
Measure the weather and stay aware of climate change!

Things used in this project
Hardware components
Hand tools and fabrication machines
Drill / Driver, Cordless
Story
About
Ever want to know exactly what the weather is like outside? Curious about how climate change has influenced your local weather? Do you want to know what the previous weather records are? I’ve made a weather almanac to find out!
I wanted to make a weather almanac to remind us of historic local conditions and to document daily climate changes. It can be difficult to see the changes to our climate. By building a weather station and a weather almanac, I can not only document daily temperature data, but also monitor how the weather has changed over the decades.
There are three parts to my weather almanac. First, I built a weather station with temperature, humidity, rain, snow, and wind sensors. The weather station is powered with a solar panel to ensure I can monitor the local weather continuously. Second, I collected historical weather data by downloading it from a server and emailing it to myself to compare with present day data. Third, I configured a raspberry pi all sky camera to take images during the day and utilized machine learning to identify cloud cover. This can be used in the future to improve historical weather data by ensuring we only compare similar situations in the weather almanac email. Together, the aspects of my weather almanac provide a better picture of past and present weather for my region.
tl;dr
Go straight to the code and tweak for your situation
Part One: The Weather Station
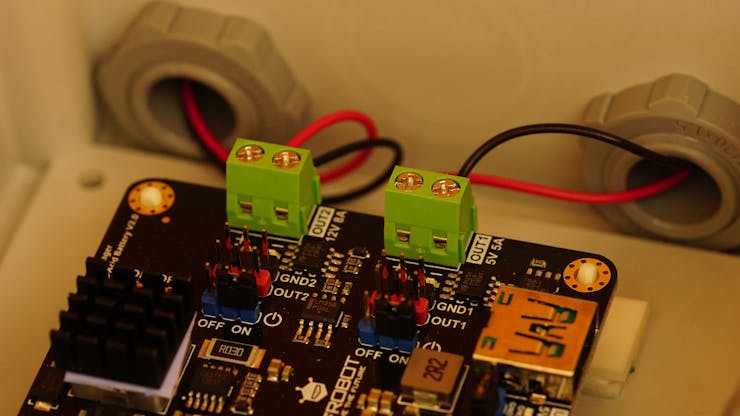
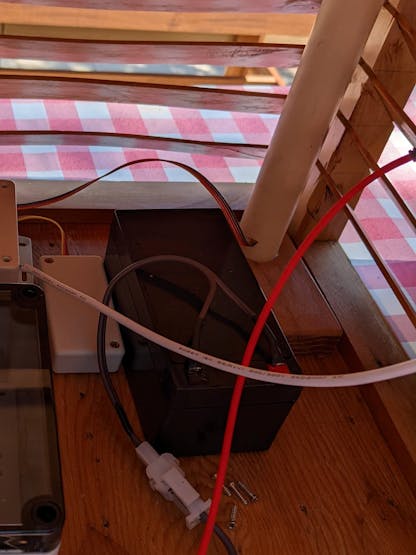
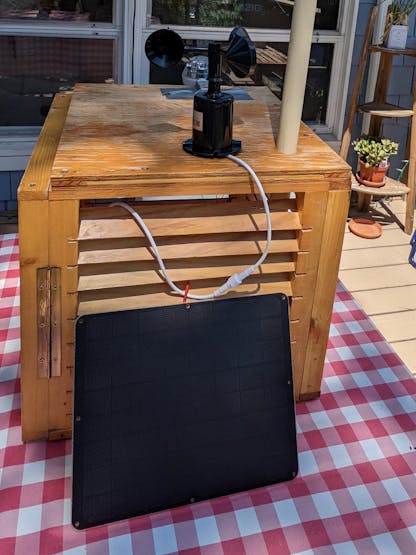
First, I wanted to measure all the weather data with an Arduino MKR WiFi 1010. The weather fields I'm interested in measuring are temperature + humidity + barometric pressure (BME280 sensor), the rain (RG-11 sensor), and the wind (CALT wind sensor). I also wanted the weather station to always run outside, so I set up a 18V solar panel and a 12V 3.4 Ah lead acid battery to power the station. The rain sensor I chose runs off of 12V, and the Arduino MKR WiFi runs off of 5V. Fortunately with the DFRobot solar panel management circuit, I have been able to supply both 12V and 5V with the solar panel + management circuit + lead acid battery combination.
***Note: The BME280 along with a ultrasonic sensor in a bid to measure snow depth were installed previously and are discussed more here and here.***
I started by testing the weather sensors indoors and then testing them outside. I learned how to send the weather data using the MQTT protocol via some previous projects I worked on.
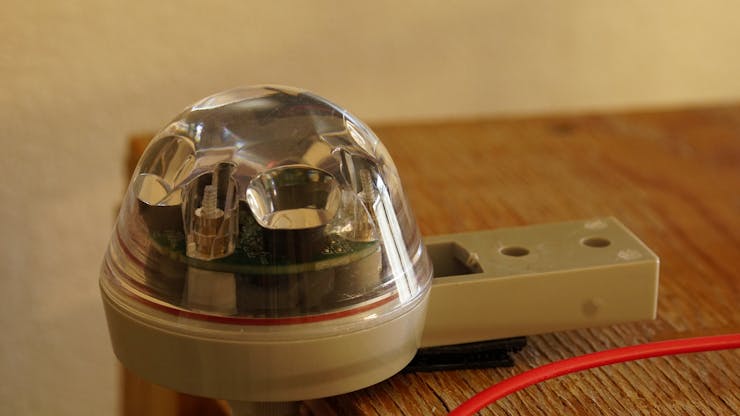
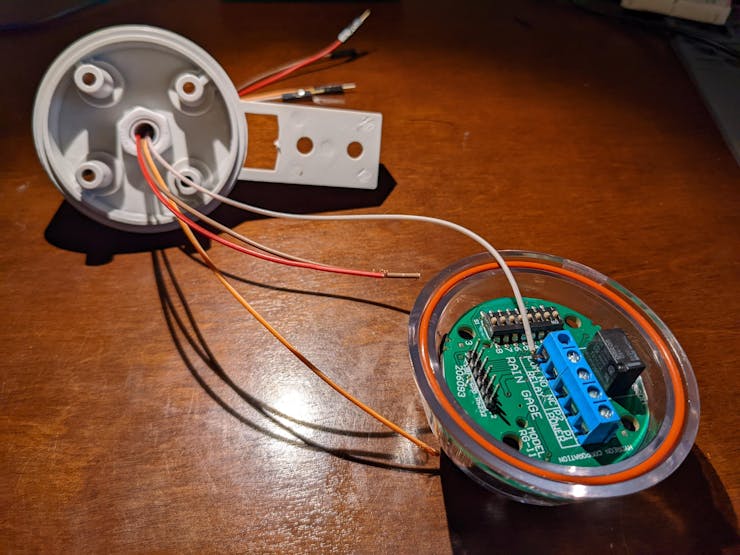
For the RG-11 rain sensor, I connected wires to the sensor through the cable gland built into the sensor. Once this was sealed and connected to my Arduino MKR WiFi 1010, I added this sensor to a digital IO pin and made it an interrupt routine:
//Configure rain pin to run as interrupt
LowPower.attachInterruptWakeup(rain_pin, callback, FALLING);
After attaching this via an interrupt, I wrote the following interrupt routine with the appropriate bucket size I used on the rain sensor.
void callback() {
// This function will be called once on device wakeup
// You can do some little operations here (like changing variables which will be used in the loop)
// Remember to avoid calling delay() and long running functions since this functions executes in interrupt context
Serial.begin(9600);
delay(10);
//##############################################
float bucket = 0.01; // Configure this for your sensor
//##############################################
rainfall = rainfall + bucket;
Serial.println("Running interrupt code");
Serial.print("Rain amount is: ");
Serial.print(rainfall);
Serial.println(" in");
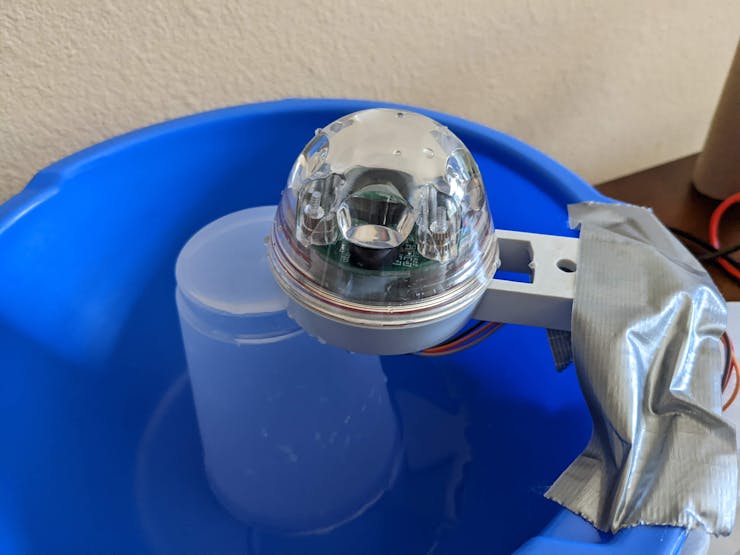
}Next I wired the rain sensor to the Arduino MKR WiFi, and then tested the rain sensor with some water and a bucket. After this successful test, I placed this sensor on my weather station enclosure.
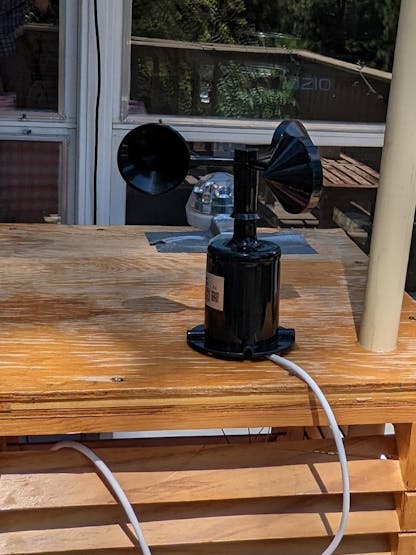
The wind sensor and BME280 temperature, humidity, pressure and elevation sensor connections came next, and I connected them with the following existing examples.

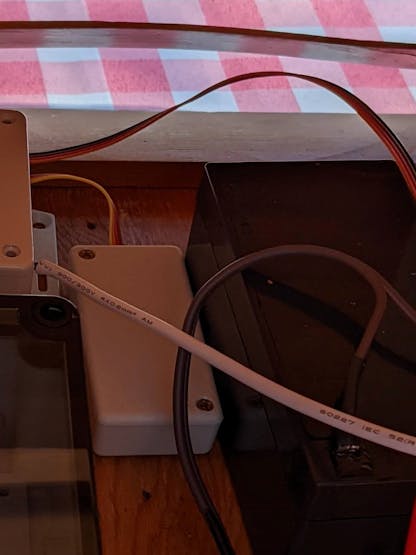
All of these sensors were powered by a 12V lead acid battery and a 18V solar panel via a solar panel power management circuit.
The rest of the code measures the other sensors, sends the weather data to a Linux server running MQTT, and then puts the Arduino to sleep.
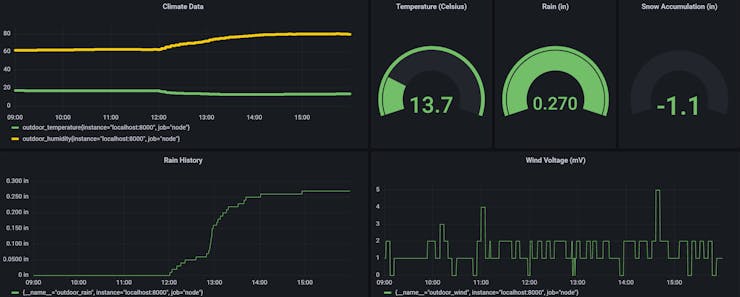
The data is displayed in Grafana Cloud dashboard, linked to my account able to be read from anywhere with internet. This is what my dashboard looks like:
Part Two: Historical Weather Data
Equally important to measuring data is summarizing historical data. I am really fortunate to have awesome data thanks to Los Alamos National Laboratory. This is the weather data I am using: https://weathermachine.lanl.gov/.
First I read the past data in as a python data frame:
inputData = pd.read_table("raw_laarc_24_194001010000.txt",delim_whitespace=True,  skiprows=6)
df = DataFrame(inputData)
I determine what day it currently is, and then pull all of the data from this day throughout history and compute some summary statistics:
# Determine day of year for weather calculation
day_of_year = datetime.datetime.now().timetuple().tm_yday
# Pull out temperature data and years from dataframe
dayTemp = np.array((df2.loc[(df2.ddd == day_of_year), 'deg-C']))
yearTemp = np.array((df2.loc[(df2.ddd == day_of_year), 'yyyy']))
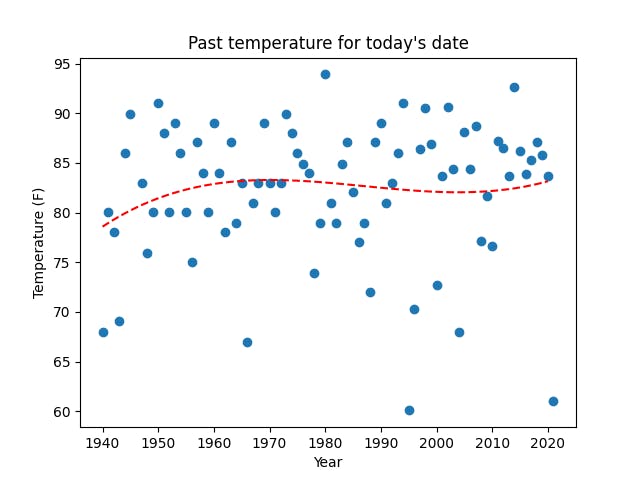
dayTempNums = pd.to_numeric(dayTemp)I do the same for rain and snow data. Then I separate the historical temperature data before and after 1980 so I can see recent and later temperature extremes.
# Look at before and after 1980 to see if it has changed
compYear = np.argmin(abs(yearTemp - 1980))

earlyMeanTemp = round(np.nanmean(convTemp[0:compYear]),1)
lateMeanTemp = round(np.nanmean(convTemp[compYear:-1]),1)

earlyMaxTemp = round(np.nanmax(convTemp[0:compYear]),1)
lateMaxTemp = round(np.nanmax(convTemp[compYear:-1]),1)
Next, I read the previous day's data so I can see what I measured and so I can complement the historical data. To do this, I store the weather data into a SQLite Database. Each time the Linux computer receives an MQTT message, the computer saves data into an SQLite database. These values are then read in once a day and sent with the historical weather data.
To send the historical weather data and yesterday's data, I use Python to send an automated email message. I have edited my Linux computer's system to always run my weather almanac program at 7 am local time each day to tell me about the weather history and my weather measurements. This way I always am reminded of what conditions we are are living every day.
The Weather Almanac Email Message
This is an example of the message I am currently sending:
"On this day in history:TemperatureThe mean temperature is: 82.3FThe max temperature was: 93.9F during 1980The min temperature was: 60.1F during 1995
Separating temperature data above and below 1980 to see recent vs past local extremes:Before 1980 the mean and max temperature were: 82.1F and 91.0FAfter 1980 the mean and max temperature were: 83.1F and 93.9F
Rain
The max rainfall was: 1.1in during 1944SnowThe snowfall was: 0.0in during nanHere is what actually happened yesterday:The mean temperature was: 69.44F
The max temperature was: 82.74FThe min temperature was: 52.68FThe rainfall was: 0.0It was cloudy yesterday."
The Weather Almanac Aftermath
Yay weather almanac! It can be difficult to realize the direct impact that climate change has on my environment due to the length of time that I experience it. The weather almanac and my weather station provides me with a tangible, quantitative reminder that makes sure I always remember.
While normally I would not notice a 1-2 degree Fahrenheit change, having it reported to me every day reminds me. Even though the temperature data I have access to only is in the 1900s, I have enough data to see a change before and after 1980 in my location.
Part Three: Cloud Cover Data via Machine Learning
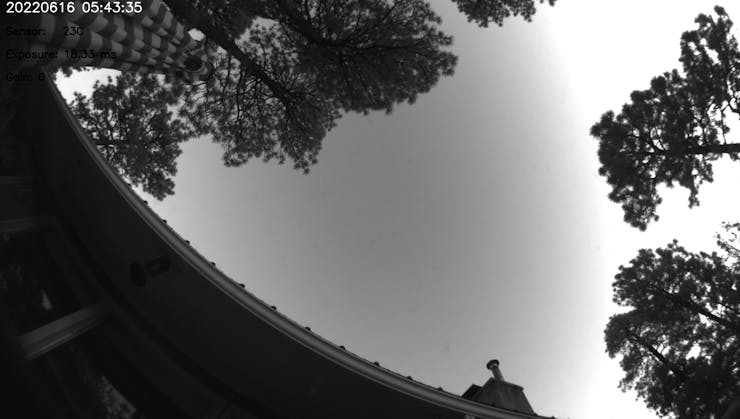
My last part of the weather almanac was building a cloud sensor. I wanted to ensure the weather almanac data I report is comparing similar situations for temperature and precipitation data. At the moment, my weather almanac data is not data-rich, so I have decided to pause filtering my weather almanac data for cloud coverage, but I still wanted to identify clouds or clear sky from optical data. I had a raspberry pi taking all sky photos for the night. I followed this example on how to configure an all sky camera and raspberry pi. I am saving images in the daytime, and I am transferring an image every day at 3 pm (15:00) daily to a Linux box I have to determine if it is cloudy or not.
I decided to pass my image to a TensorFlow program I modified for my purposes. I am closely following this example for image classification. I have built two image classes, clear and cloudy.
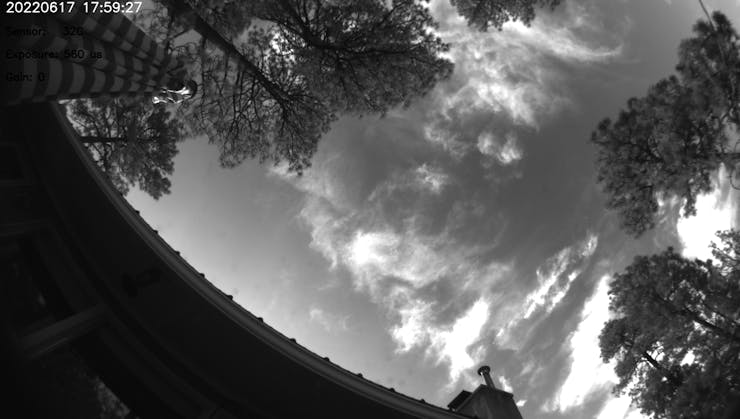
I trained the model on images collected by the all sky camera in clear and cloudy conditions. After training the model, I use the following python function to classify the image with machine learning.
def identifyClouds(myFile, model, class_names):
    ################################################################
    # Predict on new
    #myFile = 'noCloud.jpg' # Path to images, .tar.gz is fine with the untar option below
    fullPath = os.path.abspath("./data/toIDFiles/" + myFile)  # get full path for keras command
    image_path = tf.keras.utils.get_file(myFile, origin='file://'+fullPath)
    img = tf.keras.utils.load_img(
    image_path, target_size=(img_height, img_width)
    )
    img_array = tf.keras.utils.img_to_array(img)
    img_array = tf.expand_dims(img_array, 0) # Create a batch
    predictions = model.predict(img_array)
    score = tf.nn.softmax(predictions[0])
    print(
    "This image most likely belongs to {} with a {:.2f} percent confidence."
    .format(class_names[np.argmax(score)], 100 * np.max(score))
    )
    return(class_names[np.argmax(score)])
So far this model works excellently at identifying clouds or no clouds in the images I feed it. This result will improve how the weather almanac returns historical values similar to the current day's weather conditions.
The weather almanac collection of codes, Arduino weather station, and Raspberry Pi all sky camera all help visualize weather data and educate the user about local climate change impacts. This project
-creates a daily experience around weather and clouds -highlights temperature changes before/after 1980 -is an educational tool regarding how weather has changed in recent history
Schematics
Weather Station
Fritzing diagram of how the circuit components are connected. My wind sensor runs off of 5V power and is subsequently buffered before going to the IO pins of the Arduino.
Code
Weather Almanac
The weather station code, the machine learning code, and the email and read old weather data code
The article was first published in hackster, June 30, 2022
cr: https://www.hackster.io/akendrick/weather-almanac-56af10
author: Alex Kendrick


