Cold Storage Monitoring System Based on Cellular& Wi-Fi Mesh

In this project will guide you to build an ML Cluster Based Cold Storage Monitoring System with Cellular connectivity.
Things used in this project
Hardware components
Software apps and online services
Blues Wireless Notehub.io [https://www.hackster.io/blues-wireless/products/blues-wireless-notehub-io?ref=project-e9ea3c]
Story
When it comes to Cold Storage Monitoring systems, my mind typically conjures up visions of multiple devices, sensors, and cloud connections. Yet, they all have a shared feature, which is that all the devices are linked directly to Cloud Services. For example, if you had thousands of containers that you wanted to monitor all in one place with minimal human intervention.
Is it difficult? This is not only true for Cold Storage Monitoring, it is applicable to most environmental monitoring systems.
So, I have two ideas for this situation:
Use Machine Learning to find anomalies Creating a cluster sensor network
How about making a system with both ideas, clustered sensor network based anomaly detection system.
Okay, now we have the best ground station cluster, but how you are going to connect with cloud. One of the best and easy way is Wi-Fi, but when Wi-Fi is down what will happen?
And most of the Coolant system are in remote areas, so anything can happen. For this situation, the one and only
solution is Cellular connectivity. So, now we have ML cluster based coolant monitoring with cellular powered.
Now let's start the process.
Hardware Requirements:
LTE-M Notecard GlobalNotecarrier A with LiPo, Solar, and Qwiic ConnectorsRaspberry Pi 4BM5SticK CBeetle ESP32-C3FireBeetle ESP32DHT11 Sensor
Software Requirements:
Arduino IDEBlues NotehubQubitroEdge Impulse
Credits:
My sincere gratitude to DF Robot for sent me the cute little Beetle ESP32-C3 boards as samples.
Flow Diagram:

In this project, we are going to use 5 different platforms product or services.
DF Robot Fire Beetle ESP32Edge ImpulseBlues NotecardQubitroTwilio
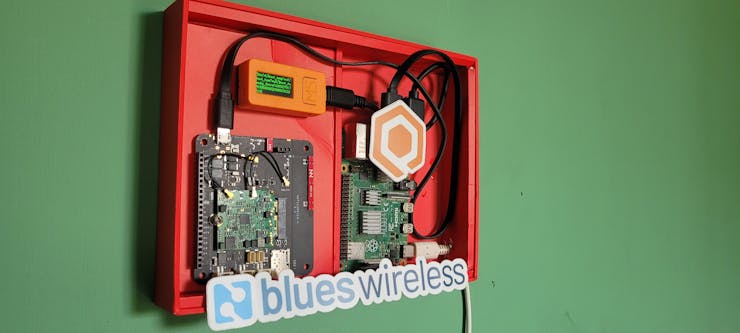
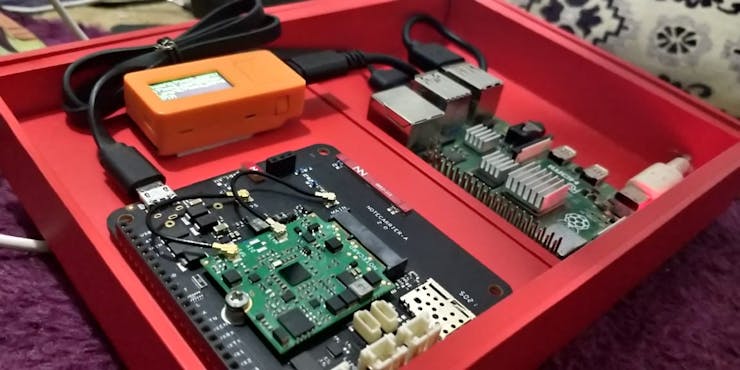
Master Node Circuit Connection:
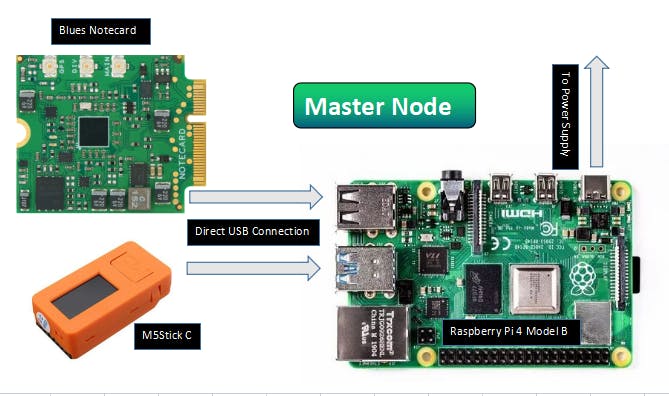
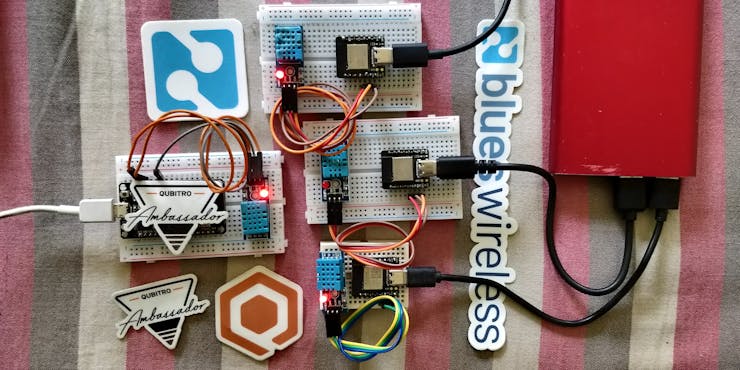
We are actually going to do two separate hardware configurations. First one is master node which collect all the sensor node data, and it will publish it to the cloud network through cellular connection. And you need a Raspberry Pi for this because in this master node everything will be connected in serial ports.
Just connect Blues Notecard and M5Stick in Raspberry Pi's USB port. Don't need any hard-wiring and soldering.
Slave Node Circuit Connection:
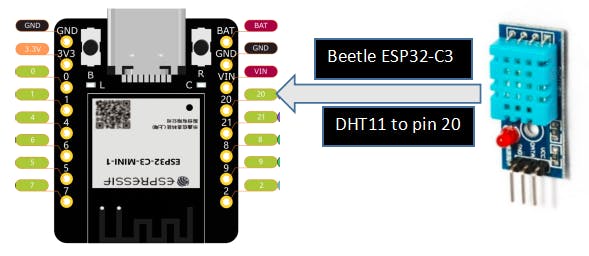
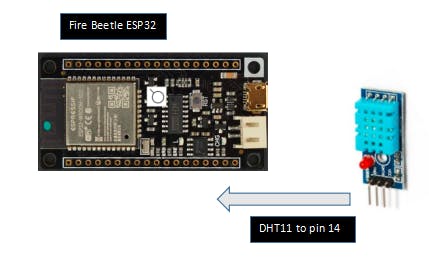
First I tried to implement this with Beetle ESP32, If you don't have a ESP32 C3 you can use the normal ESP32.
For the data collection and anomaly detection, we are going to use Beetle ESP32-C3 with DHT11 sensor. Connect DHT11 to Digital pin 21 of the ESP32-C3.
Edge Impulse Anomaly Classification:
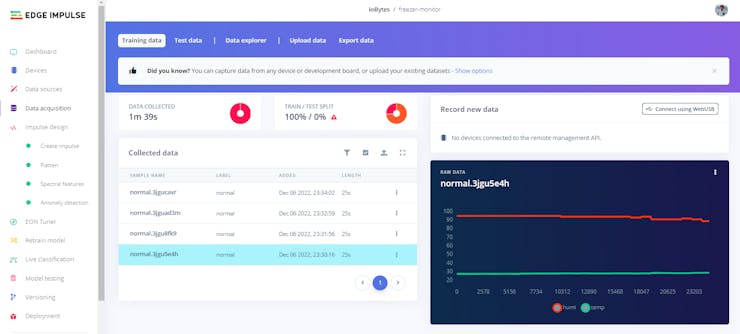
First, we need to collect some normal environmental data, and we have to make the EI model to classify anomaly if there is any abnormal environmental activity detected.
Here is the sketch to use edge impulse data collection.
#include <DHT.h>
#define DHT_SENSOR_PIN  14 // ESP32 pin GIOP14 connected to DHT11 sensor
#define DHT_SENSOR_TYPE DHT11

DHT dht_sensor(DHT_SENSOR_PIN, DHT_SENSOR_TYPE);
#define LED_R_PIN           2       // Red LED pin

#define FREQUENCY_HZ        50
#define INTERVAL_MS         (1000 / (FREQUENCY_HZ + 1))

void setup() {

  pinMode(LED_R_PIN, OUTPUT);
  digitalWrite(LED_R_PIN, HIGH);
  Serial.begin(115200);
  dht_sensor.begin(); // initialize the DHT sensor
}

void loop() {
  float humi  = dht_sensor.readHumidity();
  // read temperature in Celsius
  float tempC = dht_sensor.readTemperature();
  // read temperature in Fahrenheit
  float tempF = dht_sensor.readTemperature(true);

  static unsigned long last_interval_ms = 0;

  if (millis() > last_interval_ms + INTERVAL_MS) {
    last_interval_ms = millis();
    Serial.print(humi);
    Serial.print(",");
    Serial.println(tempC);
  }
}
Use edge impulse data forwarder, then collect all the sensor data.
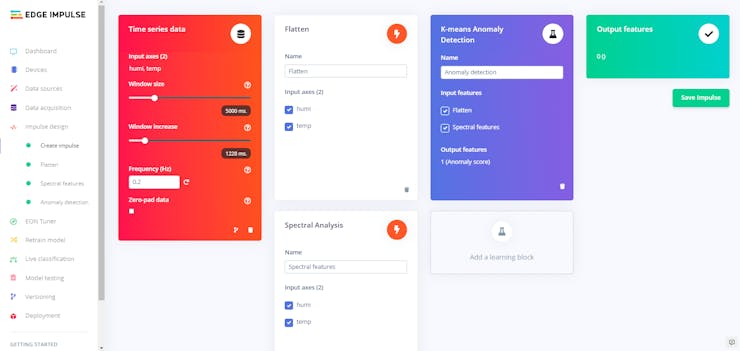
In this project I have used multiple data (temperature, humidity). Here is my impulse design.
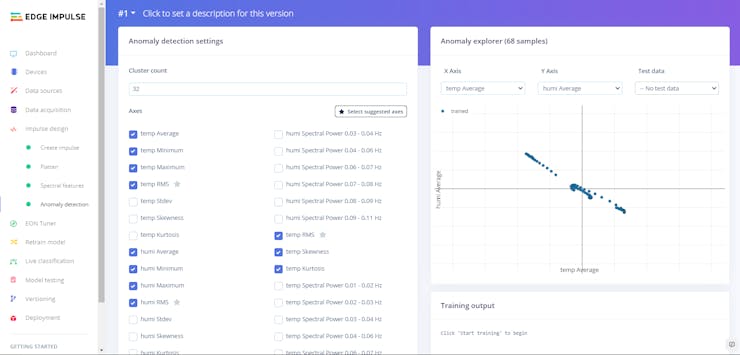
Anomaly detection samples.
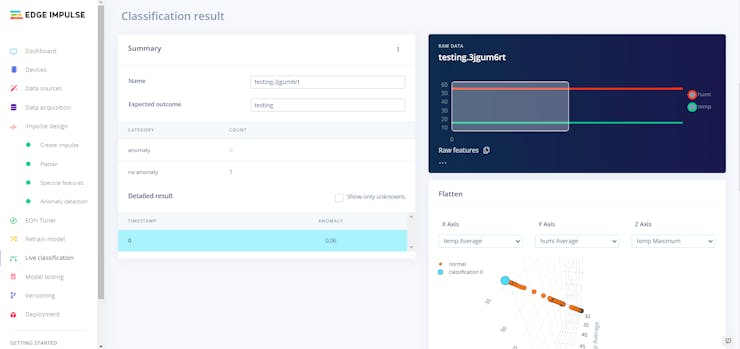
Here are some of the live classification results.
Finally, build an Arduino library for ESP32 integration.
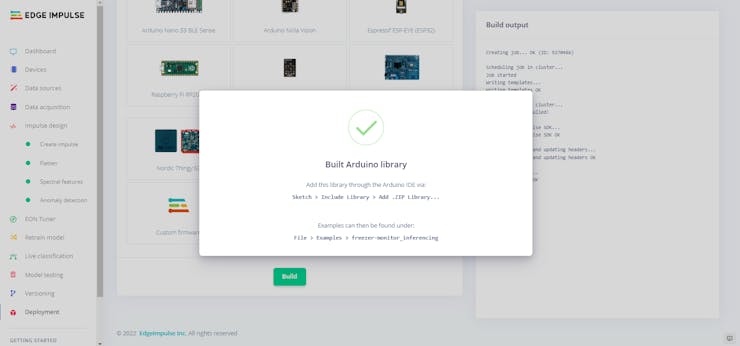
I have uploaded the final development libraries in this project. So, now we have edge impulse model, this can detect abnormal anomalies. Next thing is to add cluster network into this.
Making a cluster sensor network:
Here is the simple Arduino Sketch to use Wi-Fi mesh between ESP32 and Node MCU boards.
Before uploading this sketch, you have to install some libraries.
ArduinoJsonTaskSchedulerESPAsyncTCP (ESP8266)AsyncTCP (ESP32)
#include "painlessMesh.h"
#include <Arduino_JSON.h>

// MESH Details
#define   MESH_PREFIX     "Blue" //name for your MESH
#define   MESH_PASSWORD   "Key" //password for your MESH
#define   MESH_PORT       5555 //default port

//Number for this node
int nodeNumber = 5;

//String to send to other nodes with sensor readings
String readings;

Scheduler userScheduler; // to control your personal task
painlessMesh  mesh;

// User stub
void sendMessage() ; // Prototype so PlatformIO doesn't complain
String getReadings(); // Prototype for sending sensor readings

//Create tasks: to send messages and get readings;
Task taskSendMessage(TASK_SECOND * 5 , TASK_FOREVER, &sendMessage);

String getReadings () {
  JSONVar jsonReadings;
  jsonReadings["node"] = nodeNumber;
  readings = JSON.stringify(jsonReadings);
  return readings;
}

void sendMessage () {
  String msg = getReadings();
  mesh.sendBroadcast(msg);
}

// Needed for painless library
void receivedCallback( uint32_t from, String &msg ) {
  Serial.println(msg.c_str());
}

void newConnectionCallback(uint32_t nodeId) {
  Serial.printf("New Connection, nodeId = %u\n", nodeId);
}

void changedConnectionCallback() {
  Serial.printf("Changed connections\n");
}

void nodeTimeAdjustedCallback(int32_t offset) {
  Serial.printf("Adjusted time %u. Offset = %d\n", mesh.getNodeTime(),offset);
}

void setup() {
  Serial.begin(115200);


  //mesh.setDebugMsgTypes( ERROR | MESH_STATUS | CONNECTION | SYNC | COMMUNICATION | GENERAL | MSG_TYPES | REMOTE ); // all types on
  mesh.setDebugMsgTypes( ERROR | STARTUP );  // set before init() so that you can see startup messages

  mesh.init( MESH_PREFIX, MESH_PASSWORD, &userScheduler, MESH_PORT );
  mesh.onReceive(&receivedCallback);
  mesh.onNewConnection(&newConnectionCallback);
  mesh.onChangedConnections(&changedConnectionCallback);
  mesh.onNodeTimeAdjusted(&nodeTimeAdjustedCallback);

  userScheduler.addTask(taskSendMessage);
  taskSendMessage.enable();
}

void loop() {
  // it will run the user scheduler as well
  mesh.update();
}
After that, I have added EI classification into the mesh section.
#include "painlessMesh.h"
#include <Arduino_JSON.h>
#include <WiFi.h>
#include <M5StickC.h>

// MESH Details
#define   MESH_PREFIX     "BlueMesh" //name for your MESH
#define   MESH_PASSWORD   "AamericanPsycho" //password for your MESH
#define   MESH_PORT       5555 //default port

float humi;
float tempC;

//EI Side
#include <DHT.h>
#include <freezer-monitor_inferencing.h>
#define DHT_SENSOR_PIN  14 // ESP32 pin GIOP21 connected to DHT11 sensor
#define DHT_SENSOR_TYPE DHT11

DHT dht_sensor(DHT_SENSOR_PIN, DHT_SENSOR_TYPE);

#define FREQUENCY_HZ        50
#define INTERVAL_MS         (1000 / (FREQUENCY_HZ + 1))

// to classify 1 frame of data you need EI_CLASSIFIER_DSP_INPUT_FRAME_SIZE values
float features[EI_CLASSIFIER_DSP_INPUT_FRAME_SIZE];
// keep track of where we are in the feature array
size_t feature_ix = 0;

static bool debug_nn = false;

float anomalydata;

typedef struct {
  int anomaly;
  int var1;
  int var2;

} WeatherData;

// Forward declarations
void getWeatherData(WeatherData &data);
void sendWeatherData(const WeatherData &data);

// Global variables
char sendBuf[256];

//LED
#define LED 2

//Number for this node
int nodeNumber = 2;

//String to send to other nodes with sensor readings
String readings;

Scheduler userScheduler; // to control your personal task
painlessMesh  mesh;

// User stub
void sendMessage() ; // Prototype so PlatformIO doesn't complain
String getReadings(); // Prototype for sending sensor readings

//Create tasks: to send messages and get readings;
Task taskSendMessage(TASK_SECOND * 5 , TASK_FOREVER, &sendMessage);

String getReadings () {
  JSONVar jsonReadings;
  jsonReadings["Box"] = nodeNumber;
  jsonReadings["Box2_temp"] = tempC ;
  jsonReadings["Box2_humi"] = humi;
  jsonReadings["Box2_Anomaly_Score"] = anomalydata;
  readings = JSON.stringify(jsonReadings);
  return readings;
}

void sendMessage () {
  String msg = getReadings();
  mesh.sendBroadcast(msg);
}

// Needed for painless library
void receivedCallback( uint32_t from, String &msg ) {
  Serial.println(msg.c_str());
  digitalWrite(LED, HIGH);
  delay(100);                           // wait for 1 second.
  digitalWrite(LED, LOW);                // turn the LED on.
  delay(100); // wait for 1 second.
}

void newConnectionCallback(uint32_t nodeId) {
  Serial.printf("New Connection, nodeId = %u\n", nodeId);
}

void changedConnectionCallback() {
  Serial.printf("Changed connections\n");
}

void nodeTimeAdjustedCallback(int32_t offset) {
  Serial.printf("Adjusted time %u. Offset = %d\n", mesh.getNodeTime(), offset);
}

void setup() {
  Serial.begin(115200);
  pinMode(LED, OUTPUT);

  M5.begin();
  M5.Lcd.setRotation(1);
  M5.Lcd.fillScreen(BLACK);
  M5.Lcd.setSwapBytes(true);
  M5.Lcd.setTextSize(1);
  M5.Lcd.setCursor(7, 20, 2);
  M5.Lcd.setTextColor(TFT_GREEN, TFT_BLACK);

  Serial.println("Edge Impulse Inferencing Demo");
  dht_sensor.begin(); // initialize the DHT sensor


  //mesh.setDebugMsgTypes( ERROR | MESH_STATUS | CONNECTION | SYNC | COMMUNICATION | GENERAL | MSG_TYPES | REMOTE ); // all types on
  mesh.setDebugMsgTypes( ERROR | STARTUP );  // set before init() so that you can see startup messages

  mesh.init( MESH_PREFIX, MESH_PASSWORD, &userScheduler, MESH_PORT );
  mesh.onReceive(&receivedCallback);
  mesh.onNewConnection(&newConnectionCallback);
  mesh.onChangedConnections(&changedConnectionCallback);
  mesh.onNodeTimeAdjusted(&nodeTimeAdjustedCallback);

  userScheduler.addTask(taskSendMessage);
  taskSendMessage.enable();
}

void loop() {

  static unsigned long last_interval_ms = 0;

  WeatherData data;
  getWeatherData(data);
  sendWeatherData(data);
  delay(3000);


  if (millis() > last_interval_ms + INTERVAL_MS) {
    last_interval_ms = millis();

    humi  = dht_sensor.readHumidity();
    tempC = dht_sensor.readTemperature();
    Serial.println("---------------------------------------------------------------------------------");
    Serial.print("Temperature : ");
    Serial.print(tempC);
    Serial.print("  Humidity : ");
    Serial.println(humi);

    // keep filling the features array until it's full
    features[feature_ix++] = humi;
    features[feature_ix++] = tempC;

    // full frame of data?
    if (feature_ix == EI_CLASSIFIER_DSP_INPUT_FRAME_SIZE) {
      ei_impulse_result_t result;

      // create signal from features frame
      signal_t signal;
      numpy::signal_from_buffer(features, EI_CLASSIFIER_DSP_INPUT_FRAME_SIZE, &signal);

      // run classifier
      EI_IMPULSE_ERROR res = run_classifier(&signal, &result, true);
            ei_printf("run_classifier returned: %d\n", res);
      if (res != 0) return;

      // print predictions
            ei_printf("Predictions (DSP: %d ms., Classification: %d ms., Anomaly: %d ms.): \n",
                      result.timing.dsp, result.timing.classification, result.timing.anomaly);

      // print the predictions
      for (size_t ix = 0; ix < EI_CLASSIFIER_LABEL_COUNT; ix++) {
                ei_printf("%s:\t%.5f\n", result.classification[ix].label, result.classification[ix].value);
      }
#if EI_CLASSIFIER_HAS_ANOMALY == 1
            ei_printf("anomaly:\t%.3f\n", result.anomaly);
      anomalydata = (float)result.anomaly;

#endif

      // reset features frame
      feature_ix = 0;
    }
  }

  // it will run the user scheduler as well
  mesh.update();
}

void getWeatherData(WeatherData &data) {
  ei_impulse_result_t result;
  // This just generates random data for testing
  data.anomaly = anomalydata;
  data.var1 = rand();
  data.var2 = rand();

}

void sendWeatherData(const WeatherData &data) {

  snprintf(sendBuf, sizeof(sendBuf), "%d,%d\n",
           data.anomaly, data.var1, data.var2);
  Serial.print(sendBuf);

}


void ei_printf(const char *format, ...) {
  static char print_buf[1024] = { 0 };

  va_list args;
  va_start(args, format);
  int r = vsnprintf(print_buf, sizeof(print_buf), format, args);
  va_end(args);

  if (r > 0) {
    Serial.write(print_buf);
  }
}
That's all simply upload this code into the slave nodes, and receiver nodes.
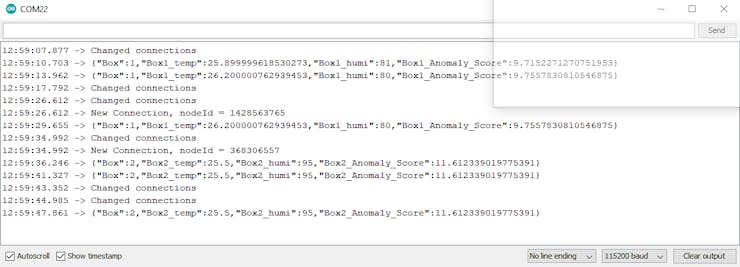
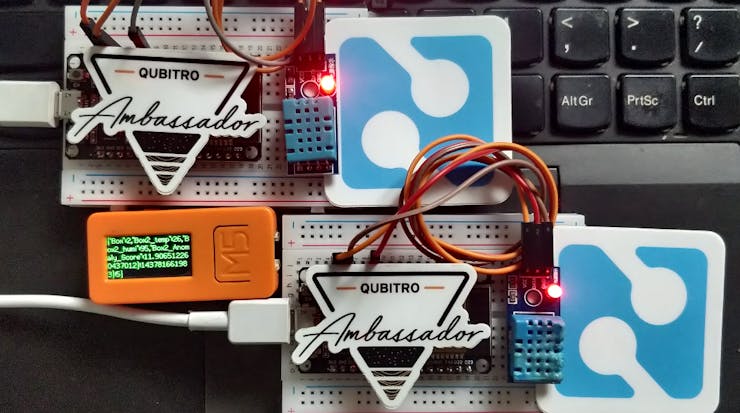
Now, our M5Stick C can read all the ESP32's data, and it will print to serial. The next step is to send this data to cloud platforms.
Raspberry Pi node receiver Setup:
Once you're done with hardware setup, we have to send out cluster data to cloud. To open the Raspberry Pi's terminal, you can use VNC or SSH. In this project, I'm going to use VNC.
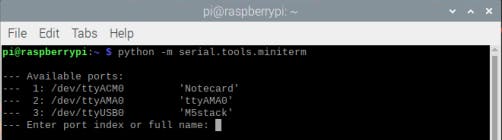
Type this following command to get the serial port names of the M5Stick C and Blues Notecard.
python -m serial.tools.miniterm
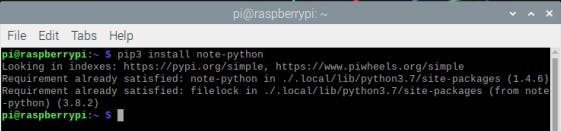
Next, install python and some necessary libraries to communicate with Blues Notecard.
pip3 install note-python
pip3 install pyserial
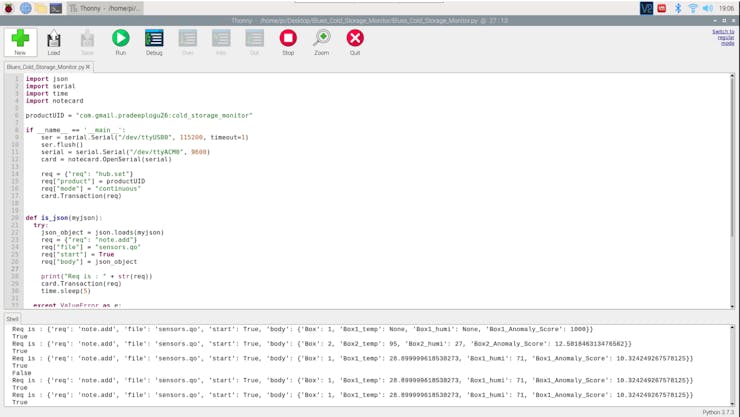
Finally, use this below python script to read the serial data from M5Stick C, and then it will send back the data to notecard.
import json
import serial
import time
import notecard

productUID = "xxxxxxxxxxxxxxxxxxxxxxxr"

if __name__ == '__main__':
    ser = serial.Serial("/dev/ttyUSB0", 115200, timeout=1)
    ser.flush()
    serial = serial.Serial("/dev/ttyACM0", 9600)
    card = notecard.OpenSerial(serial)

    req = {"req": "hub.set"}
    req["product"] = productUID
    req["mode"] = "continuous"
    card.Transaction(req)


def is_json(myjson):
  try:
    json_object = json.loads(myjson)
    req = {"req": "note.add"}
    req["file"] = "sensors.qo"
    req["start"] = True
    req["body"] = json_object

    print("Req is : " + str(req))
    card.Transaction(req)
    print("------------------------------------------------")
    time.sleep(5)

  except ValueError as e:
    return False
  return True

while True:
        if ser.in_waiting > 0:
            line = ser.readline().decode('utf-8').rstrip()
            myjson=line
            print(is_json(myjson))
The M5Stick may sometimes receive unwanted data like connection changes and delay. So, this script will check for the incoming data from M5Stick C, if the data is JSON means it will forward to Notecard or else it won't send.
Change your port names in this code also you have to create a new project in the notehub.
Once you have created the new project, just add the product ID and paste in the python script.

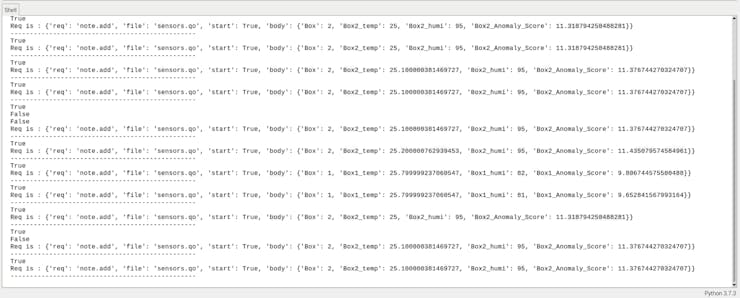
That's all now we are good to go, just run the python script it will print all the details into the window.
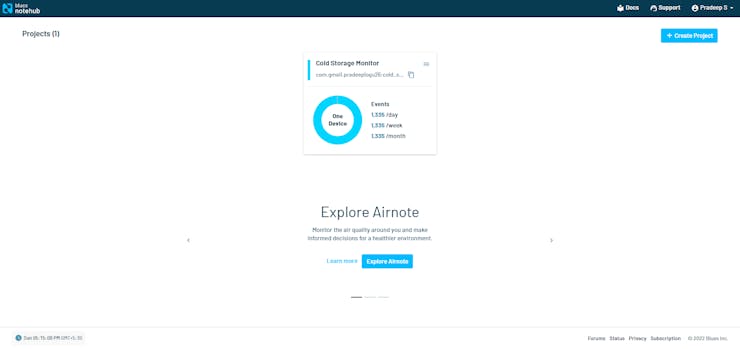
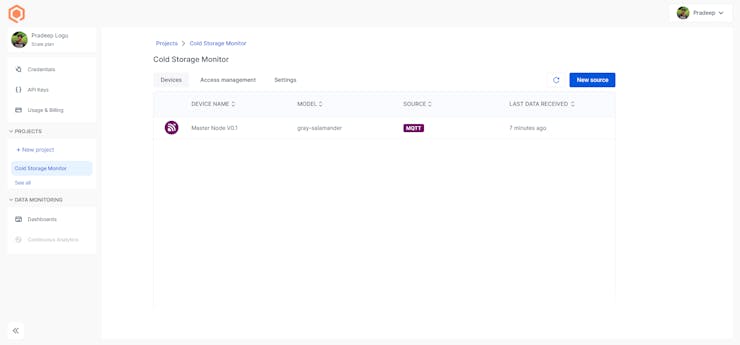
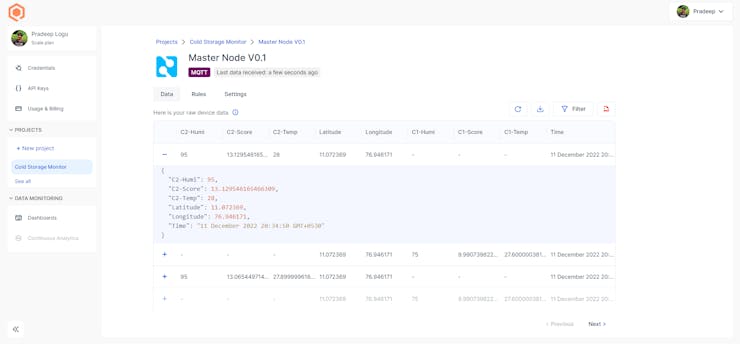
Cloud Data Routing:
Now all of our cluster data reached the cloud, let's try to retrieve them and visualize them. Open the note hub project page and look for the incoming data.

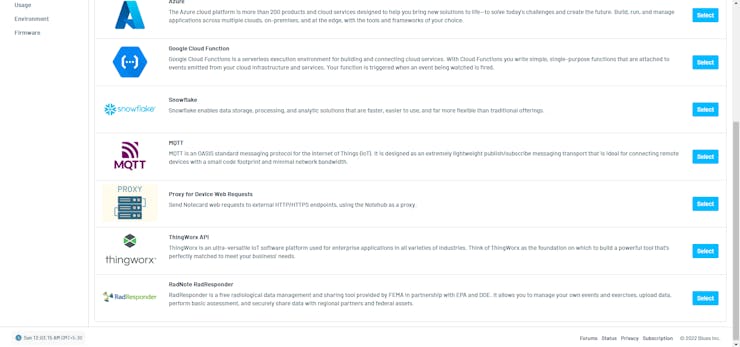
If you have seen your data in the Note hub means, perfect. We can start our data routing and visualization. Open the Route page in the notehub page and choose MQTT as an option.
Next, let's enter our MQTT Credentials into notehub.
For MQTT and data visualization, we are going to use Qubitro.
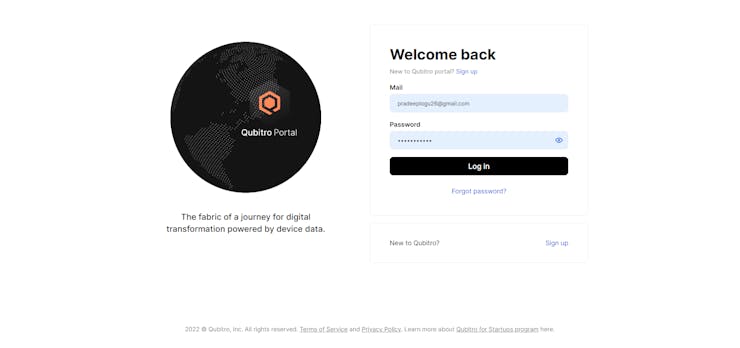
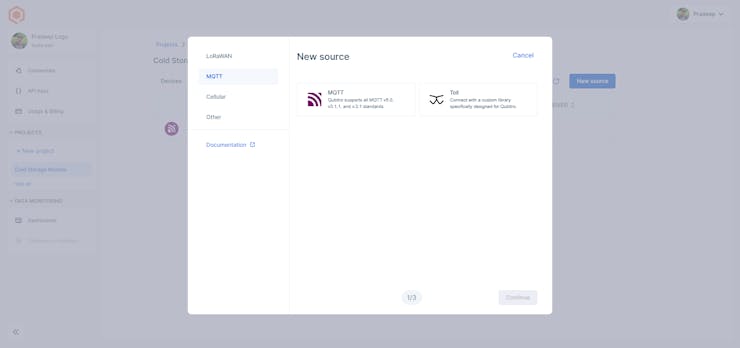
Login to the Qubitro portal and create a new MQTT connection,
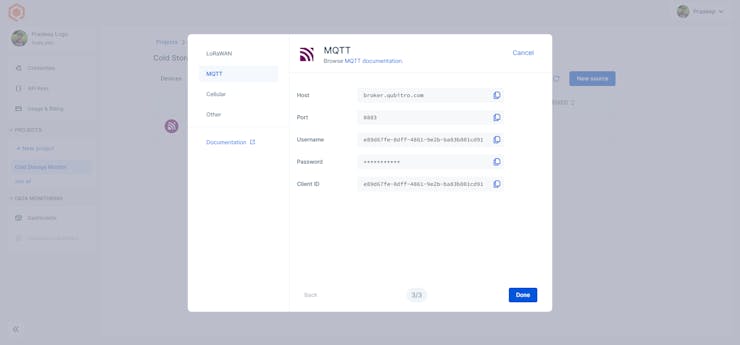
Next, enter your details, and finally you can see all the credentials. We can use these credentials in the Note hub section.
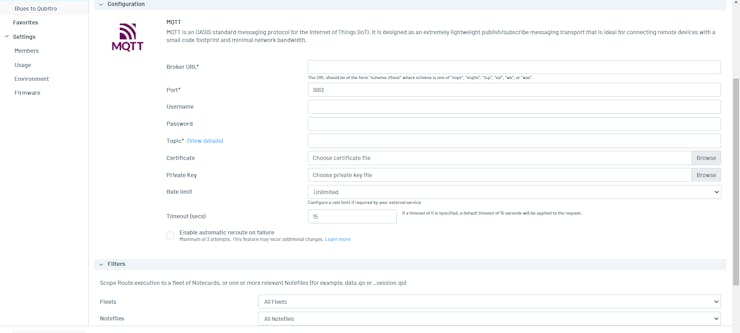
Let's put these credentials into the note hub route. Scroll down and select to transform the JSON data on the fly with a JSONata expression, since you only require a specific set of anomalous data.

That's all now are data routing is done, let's look at the Qubitro portal.
In the device panel, it will show the last activity of the device. Next, select the device and see the data.
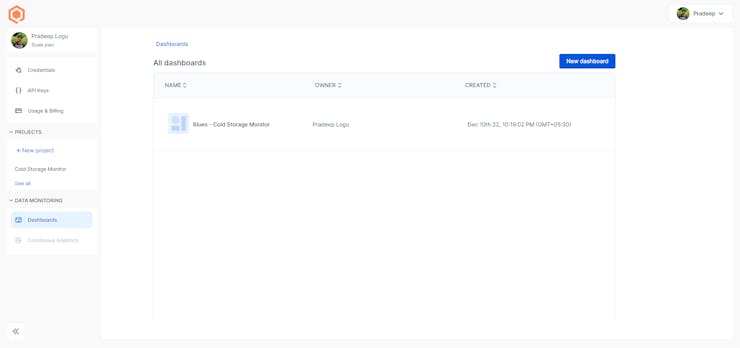
Data Visualization and Alert System:
Now we can see our data in the Qubitro's portal, next thing is we have to add some visualization to see the data in graphical format. Open the dashboard tab in the Dashboard tab and create a new dashboard.
Then click on the edit icon and select the widgets and add the data points as per your wish.
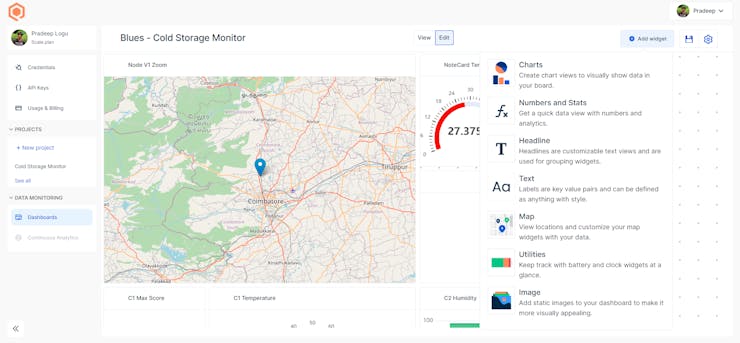
Here is my final Dashboard.
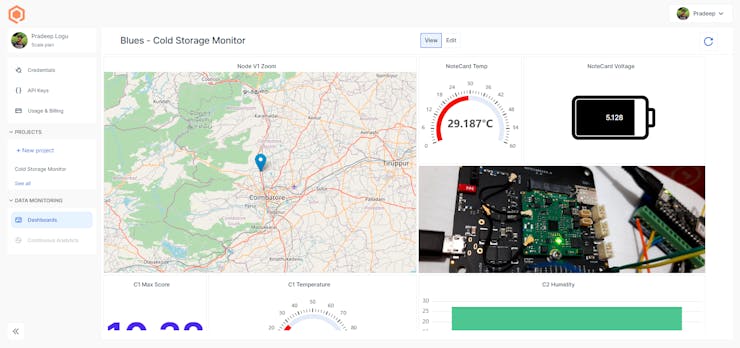
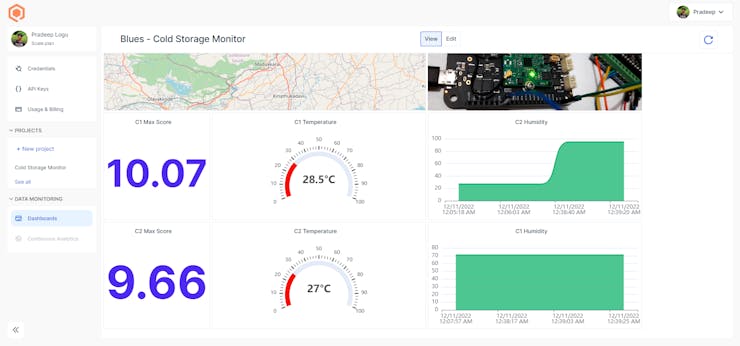
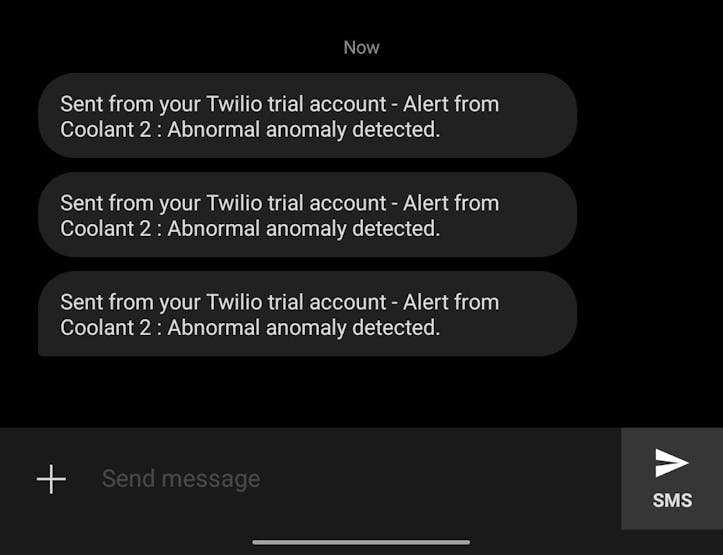
So, now you can easily monitor all units in a single page. Next, we have to add a rule to make an alert when it detects the anomaly.
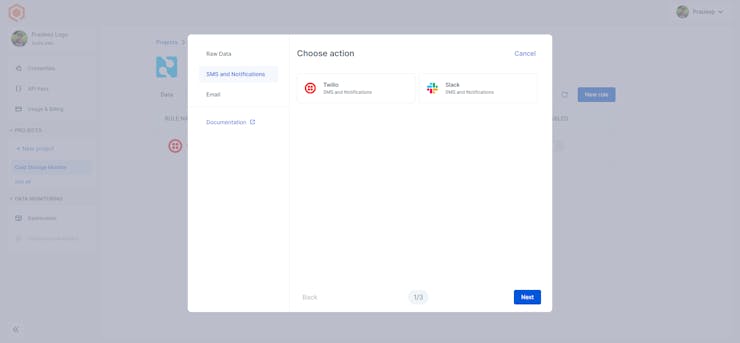
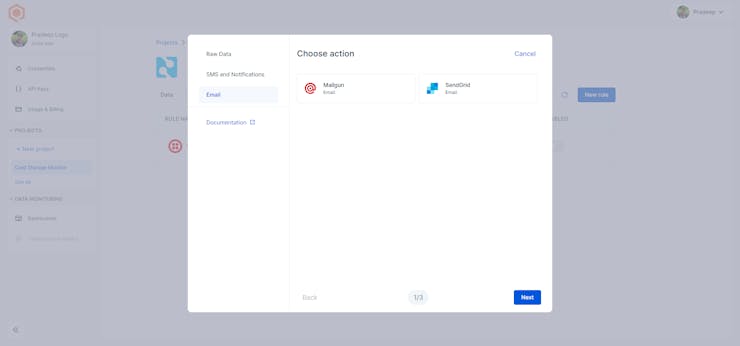
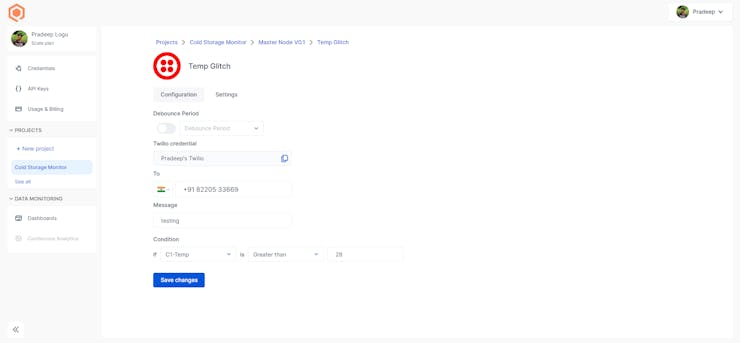
Go to the device and navigate to the Rule section, here you can see multiple choices, Now I'm going to use Twilio SMS service, but if you wish to use other service also you can do.
Next, add your credentials
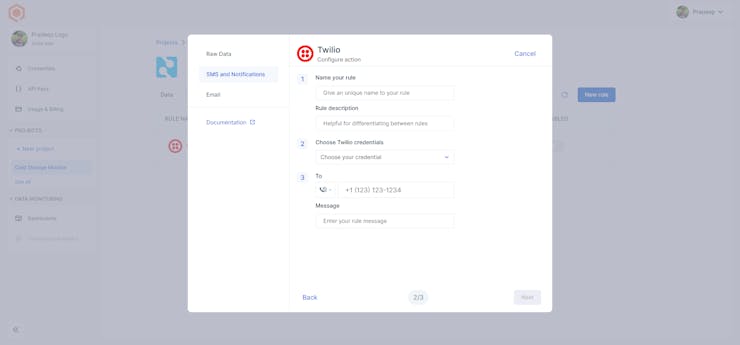
.Now we have to set our rule, I'm going to set my anomaly score <10. So, if my anomaly score detected more than 10 means it will trigger the alarm.
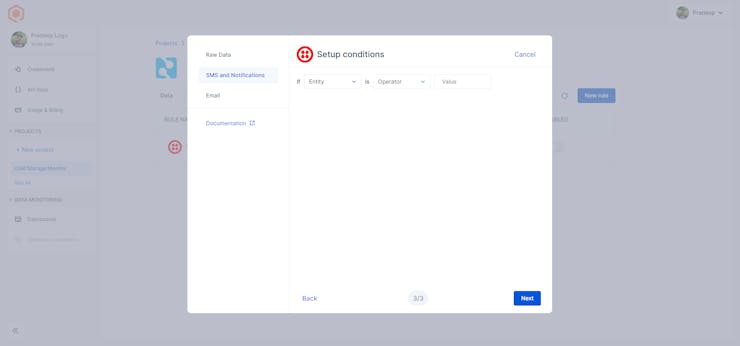
Then click next.
That's all, everything was done.
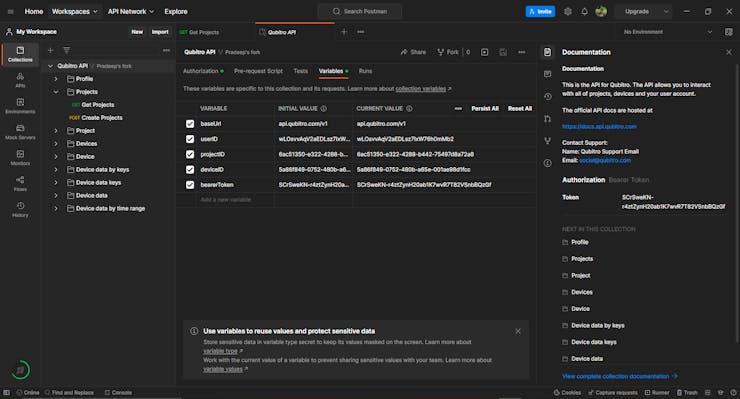
Postman API Collection:
Qubitro allows API services to make a customized data visualization through multiple endpoints like Web or Mobile applications. And mostly for developer convenient, Qubitro Introduces its API service with Postman. Use this link to clone the Qubitro's Postman Collection to your workspace.
Qubitro Postman Collections. [https://www.postman.com/qubitro-inc/workspace/qubitro-rest-api/collection/23500296-bc70a4ad-9585-4609-aaa5-1de07efb6c05?action=share&creator=24884679]
Once done the importing, just go to the variables section and enter the Qubitro credentials.
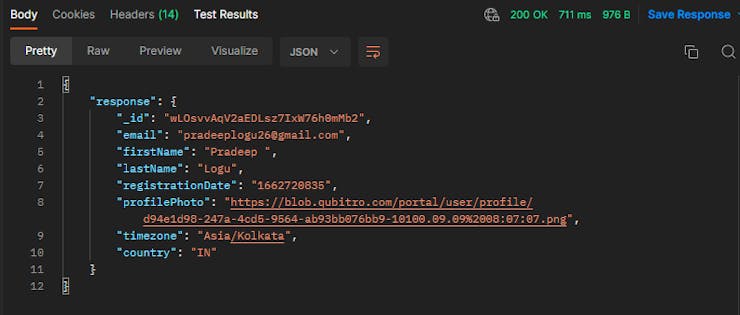
Then just navigate to the sub request section and select anyone of the requests and test that.
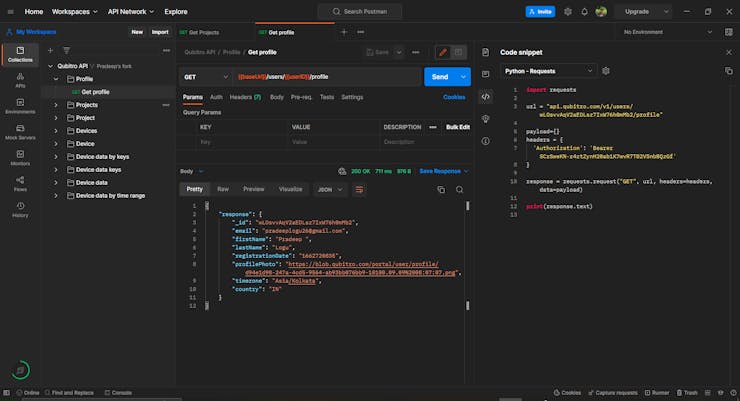
You will see the JSON data for the particular request.
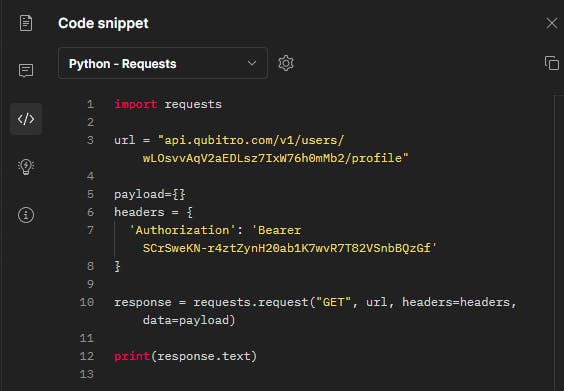
Similarly navigate to the code snippet now you will see the code snippet for the particular request.
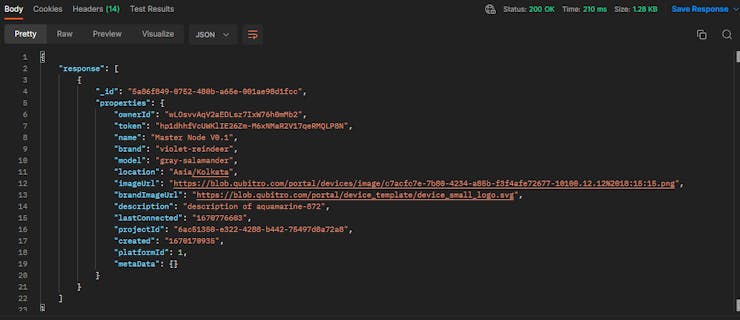
Next, go to the Get Device API Request, then click on the send request. You will see the Device info.
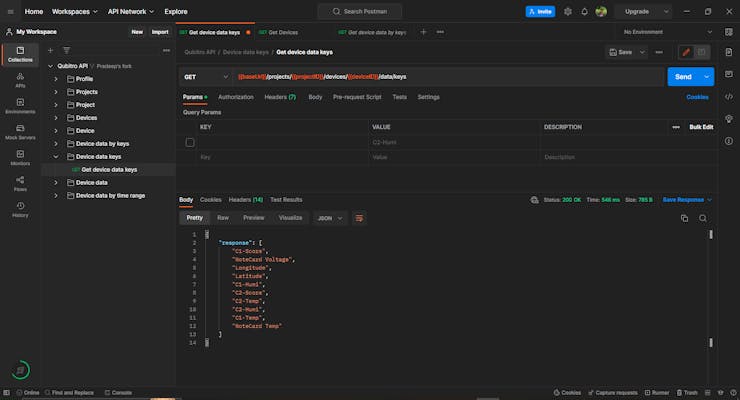
Let's try to get the data from our device. Same as Get Device check with the Get Data, you will see the all the device data.
Here is demo video of this project.
Conclusion:
_sZGq2wiMhq.jpg?auto=compress%2Cformat&w=740&h=555&fit=max)
I hope you enjoyed the demonstration of how to construct an ML clustered Temperature Anomaly Detection system with Cellular connectivity. Let's explore a different project in our next endeavor. Thank you!


