
This project aims at measuring parameters of a patient such as his or her heart rate, temperature, humidity, and the air quality using IoT.
_HxLSEfvELg.jpeg?auto=compress%2Cformat&w=900&h=675&fit=min)
Things used in this project
Hardware components
Story
COMPONENTS USED:
· Raspberry Pi 3B
· Arduino UNO
· Adafruit DHT11 Temperature andhumidity sensor
· MQ 135 Hazardous gas sensor
· Heart Pulse Sensor
· Breadboard, LEDs, Jumper wires, etc.
FUNCTION OF MAJOR COMPONENTS:
Raspberry Pi: The board acts likea complete webserver, from which a webpage is launched using the Flaskframework for python. It also has a database to store data collected fromsensors, on which it runs queries to extract relevant/selected data. It alsoplots the data graphically using the python matplotlib library.
Arduino UNO: This board performsthe function of a parallel output ADC, for interfacing analog sensors like thePulse Sensor. It provides an 9-bit output, through the I/O pins. These outputsare read by the Raspberry Pi.
DHT11: Gives readings oftemperature and Humidity
MQ-135: Detects Hazardous gasessuch as CO2, alcohol fumes, etc. Gives an alert if a threshold is crossed.
Heart Pulse Sensor: Measures heartpulse by using an LED which illuminates capillaries, and an adjacent sensor (akind of LDR), measures the variation in the light as blood passes throughcapillaries. It gives an analog output, which is converted to digital using theArduino UNO.
METHODOLOGY AND WORKING OF THE PROJECT
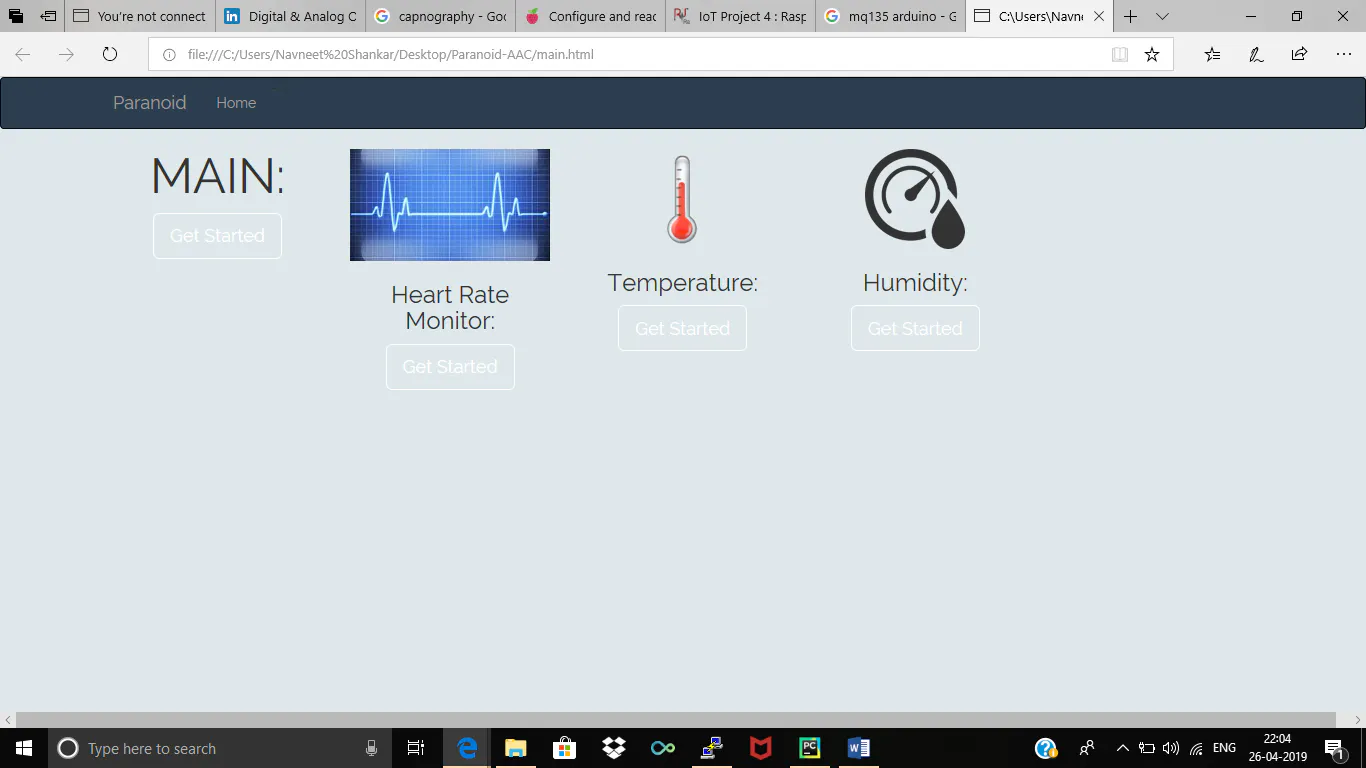
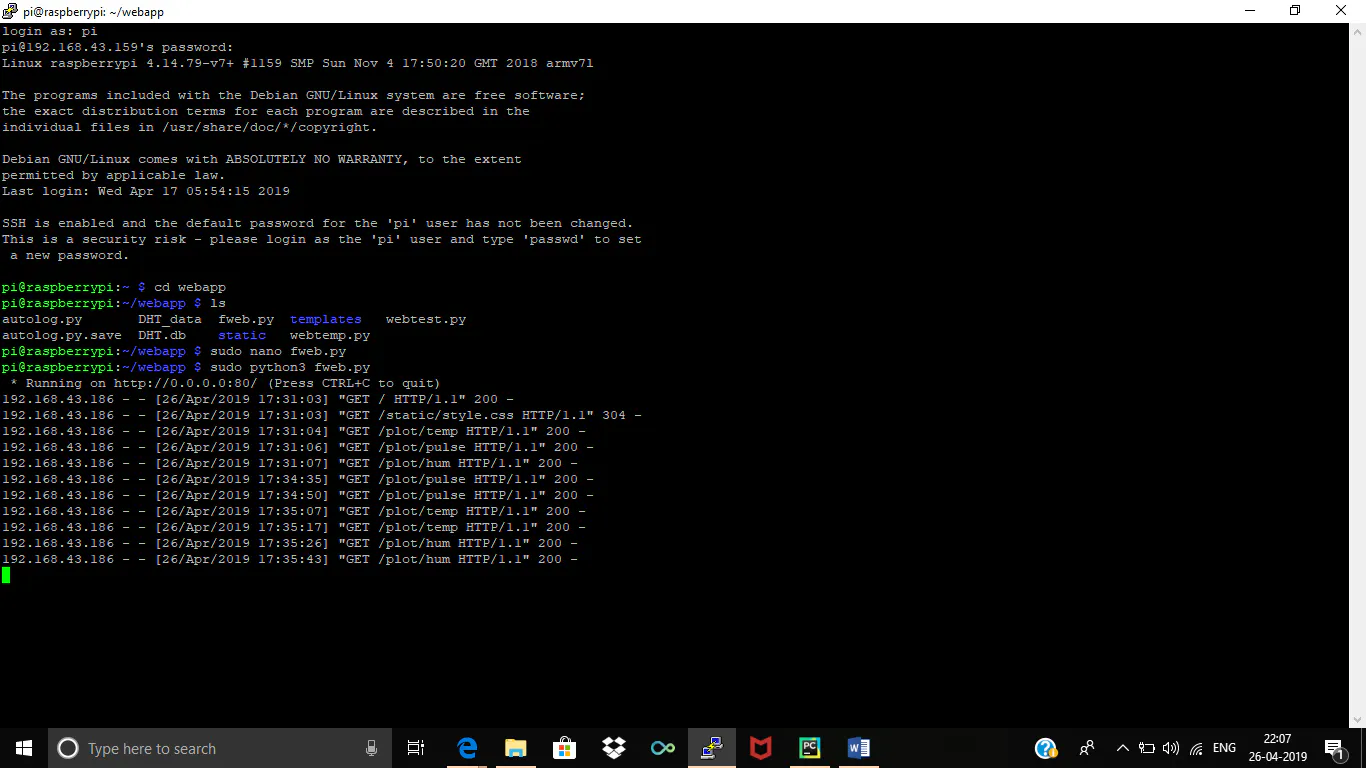
The data base onthe Raspberry PI is created using SQLite, which is a database engine. Commandline instructions are used to run queries on these databases. Instead ofmanually entering instructions, we wrote a python script, or ‘auto logger’, which automatically executes the command line instructions of this databaseengine. We then used Flask framework for python to launch a webserver from theboard. Using this we launched a man webpage, along with three subpages, whichhad the plots of Temperature, Humidity and Heart Pulse. The webpage allows theuser to enter the number of samples i.e. time period of the plot, so that thegraph for that specific time period is made visible. This is very useful if thedoctor/professional/researcher intends to do an analysis and make areport. The main page contains real timesensor data and the air quality status. For collecting data from each of thesensors, certain libraries are imported. As the raspberry PI does not have anin-built ADC, we use an Arduino UNO to generate digital signals, after readingfrom the pulse sensor. The final output is in the form of static HTML pages. Inorder to integrate them, we have used a web app platform called paranoid-AAC.For programming the raspberry PI, we used it in ‘headless mode’, in which theprogrammer has to connect to the RPI using SSH, this enables easy updating andreprogramming without any physical connection to the board.
Schematics
SAMPLE SCREENSHOTS
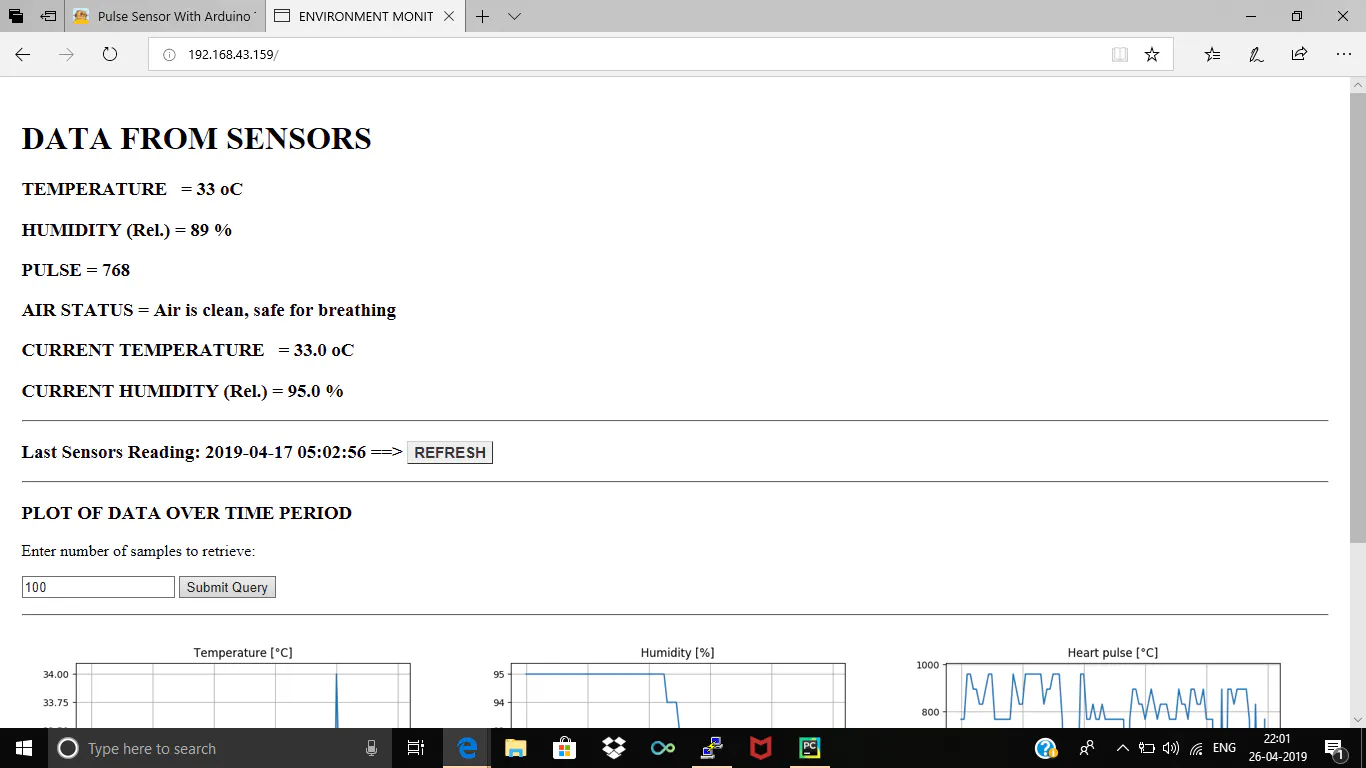
SAMPLE SCREENSHOTS
SAMPLE SCREENSHOTS
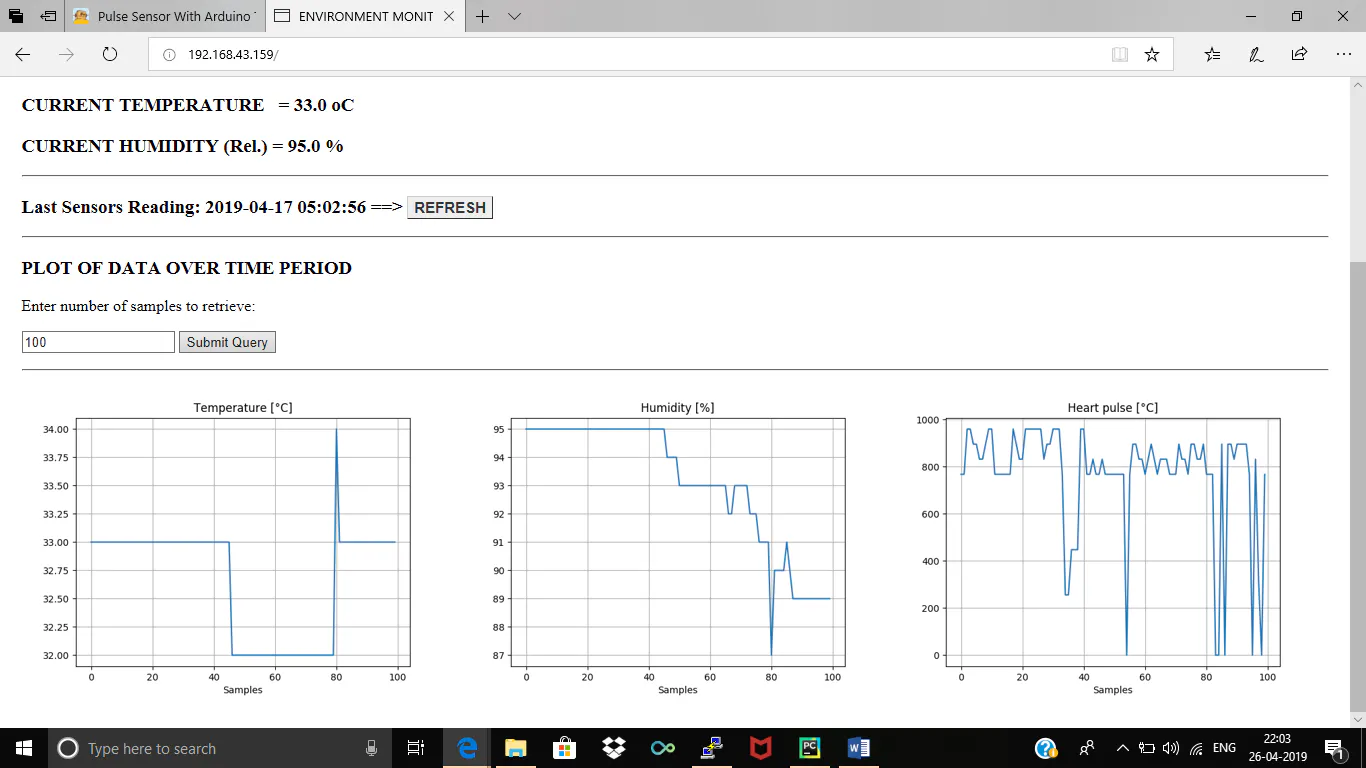
SAMPLE SCREENSHOTS
Code
Main program
Python
Launches flask webserve
import RPi.GPIO as GPIO
MQpin=4
GPIO.setmode(GPIO.BCM)
GPIO.setup(MQpin, GPIO.IN, pull_up_down=GPIO.PUD_DOWN)
from matplotlib.backends.backend_agg import FigureCanvasAgg as FigureCanvas
from matplotlib.figure import Figure
import io
import Adafruit_DHT
from flask import Flask, render_template, request, send_file, make_response
gpio=17
sensor=Adafruit_DHT.DHT11
app = Flask(__name__)


import sqlite3


# Retrieve data from database

def getData():

        conn=sqlite3.connect('DHT.db')
        curs=conn.cursor()
        for row in curs.execute("SELECT * FROM DHT_DATA2 ORDER BY timestamp DESC LIMIT 1"):

                time = str(row[0])

                temp = row[1]

                hum = row[2]

                pulse = row[3]
        conn.close()

        return time, temp, hum, pulse

def getHistData (numSamples):
        conn=sqlite3.connect('DHT.db')
        conn=sqlite3.connect('DHT.db')
        curs=conn.cursor()
        curs.execute("SELECT * FROM DHT_data2 ORDER BY timestamp DESC LIMIT "+str(numSamples))
        data = curs.fetchall()
        dates = []
        temps = []
        hums = []
        pulse = []
        for row in reversed(data):
                dates.append(row[0])
                temps.append(row[1])
                hums.append(row[2])
                pulse.append(row[3])
        return dates, temps, hums, pulse
def maxRowsTable():
        conn=sqlite3.connect('DHT.db')
        curs=conn.cursor()
        for row in curs.execute("select COUNT(temp) from  DHT_data2"):
                maxNumberRows=row[0]
        return maxNumberRows
# define and initialize global variables
global numSamples
numSamples = maxRowsTable()
if (numSamples > 101):
    numSamples = 100
# main route
@app.route("/")
def index():
        if(GPIO.input(MQpin)==1):
                warning="PPM detected, air contaminated"
        if(GPIO.input(MQpin)==0):
                warning="Air is clean, safe for breathing"
        chum,ctemp=Adafruit_DHT.read_retry(sensor,gpio)
        time, temp, hum ,pulse = getData()
        templateData = {
        'time'  : time,
        'temp'  : temp,
        'hum'   : hum,
        'pulse'   :pulse,
        'ctemp'   :ctemp,
        'chum'    :chum,
        'warning' :warning,
        'numSamples'   :numSamples
        }
        return render_template('index.html', **templateData)
@app.route('/', methods=['POST'])
def my_form_post():
    global numSamples
    numSamples = int (request.form['numSamples'])
    numMaxSamples = maxRowsTable()
    if (numSamples > numMaxSamples):
        numSamples = (numMaxSamples-1)
    time, temp, hum, pulse = getData()
    templateData = {
                'time'  : time,
                'temp'  : temp,
                'hum'   : hum,
                'pulse' : pulse,
                'numSamples'    : numSamples
        }
    return render_template('index.html', **templateData)
@app.route('/plot/temp')
def plot_temp():
        times, temps, hums, pulses = getHistData(numSamples)
        ys = temps
        fig = Figure()
        axis = fig.add_subplot(1, 1, 1)
        axis.set_title("Temperature [°C]")
        axis.set_xlabel("Samples")
        axis.grid(True)
        xs = range(numSamples)
        axis.plot(xs, ys)
        canvas = FigureCanvas(fig)
        output = io.BytesIO()
        canvas.print_png(output)
        response = make_response(output.getvalue())
        response.mimetype = 'image/png'
        return response
@app.route('/plot/hum')
def plot_hum():
        times, temps, hums, pulses = getHistData(numSamples)
        ys = hums
        fig = Figure()
        axis = fig.add_subplot(1, 1, 1)
        axis.set_title("Humidity [%]")
        axis.set_xlabel("Samples")
        axis.grid(True)
        xs = range(numSamples)
        axis.plot(xs, ys)
        canvas = FigureCanvas(fig)
        output = io.BytesIO()
        canvas.print_png(output)
        response = make_response(output.getvalue())
        response.mimetype = 'image/png'
        return response
@app.route('/plot/pulse')
def plot_pulse():
        times, temps, hums, pulses = getHistData(numSamples)
        ys = pulses
        fig = Figure()
        axis = fig.add_subplot(1, 1, 1)
        axis.set_title("Heart pulse [°C]")
        axis.set_xlabel("Samples")
        axis.grid(True)
        xs = range(numSamples)
        axis.plot(xs, ys)
        canvas = FigureCanvas(fig)
        output = io.BytesIO()
        canvas.print_png(output)
        response = make_response(output.getvalue())
        response.mimetype = 'image/png'
        return response

if __name__ == "__main__":

   app.run(host='0.0.0.0', port=80, debug=False)


