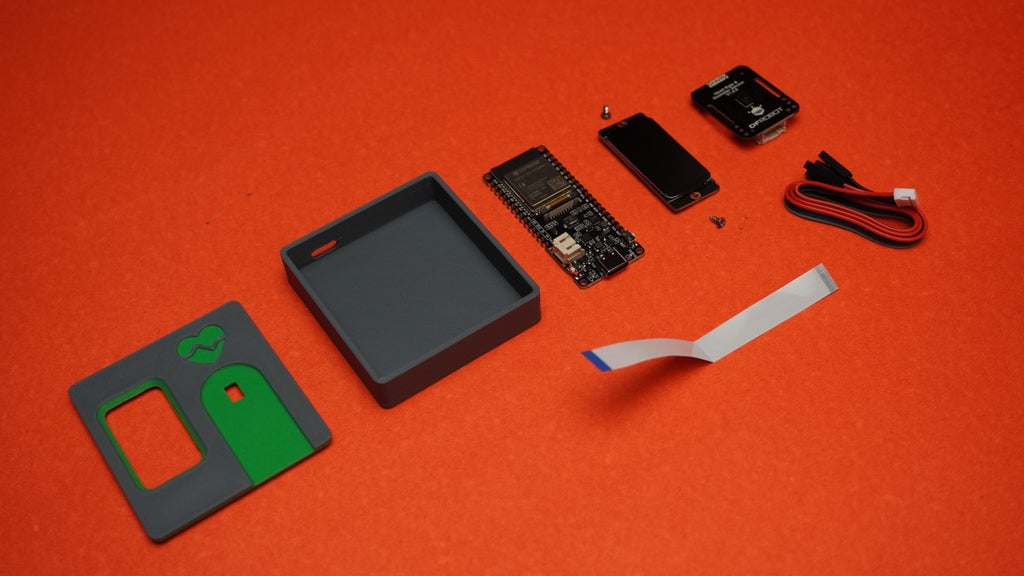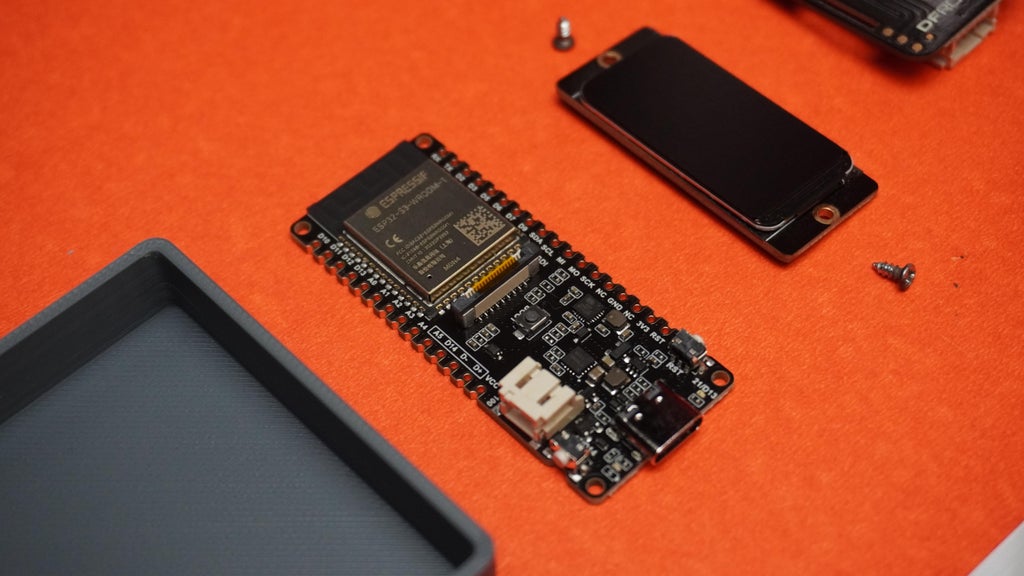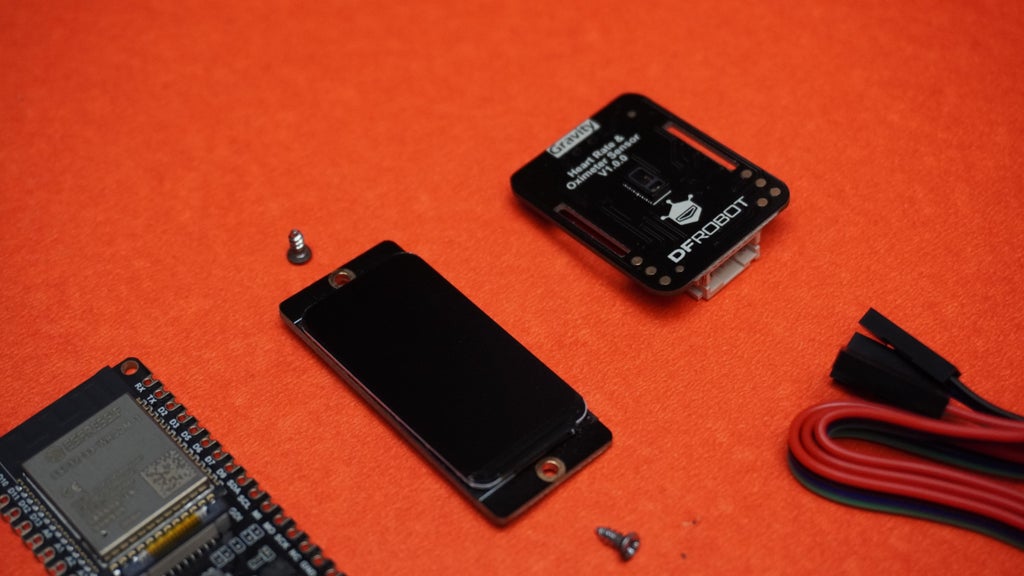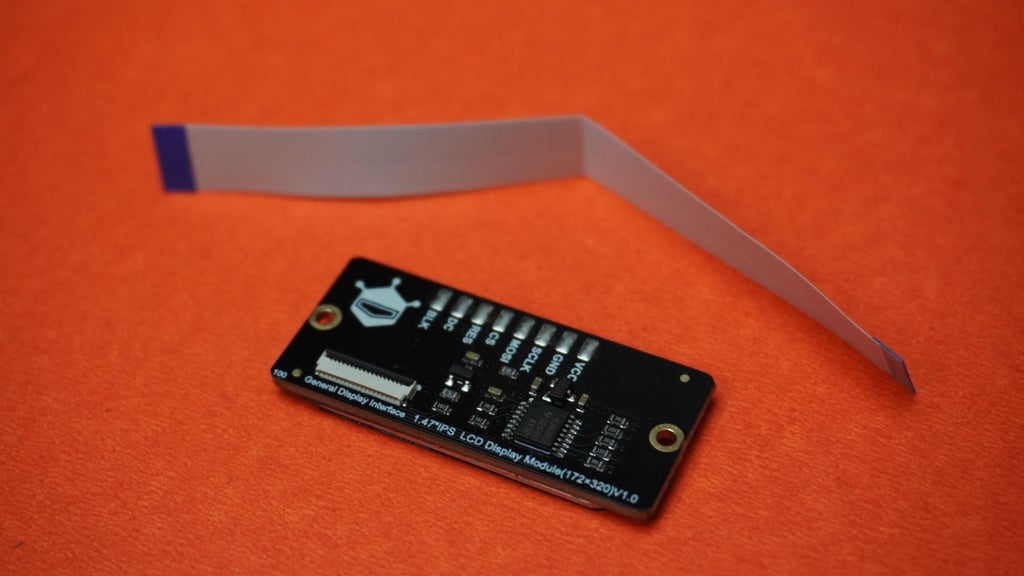
In today's world, health monitoring has become more important than ever. Imagine building your very own smart oximeter that not only measures blood oxygen levels (SPO2) and heart rate but also integrates Artificial Intelligence (AI) for smarter insights, all powered by the versatile ESP32-S3 microcontroller and a vibrant 172x320 IPS display. This DIY project isn't just about assembling hardware, it's a hands-on journey into product design, embedded systems, and AI-powered analytics.
This guide is crafted for educators, students, and hobbyists who are passionate about blending technology and health innovation. You'll learn how to interface sensors, display real-time health data, and harness the power of Edge Impulse to train and deploy AI models directly on your device. Whether you're an aspiring engineer, a tech enthusiast, or someone curious about the intersection of AI and healthcare, this project is your gateway to understanding how modern health devices are designed and built.
So, let's roll up our sleeves and start building a smart oximeter that's not only functional but also a valuable learning experience!
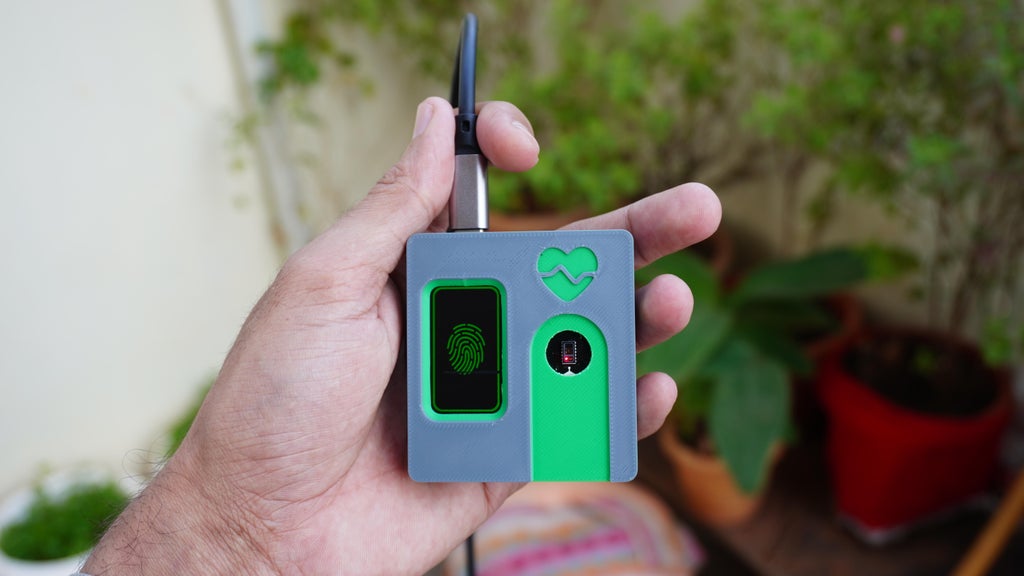
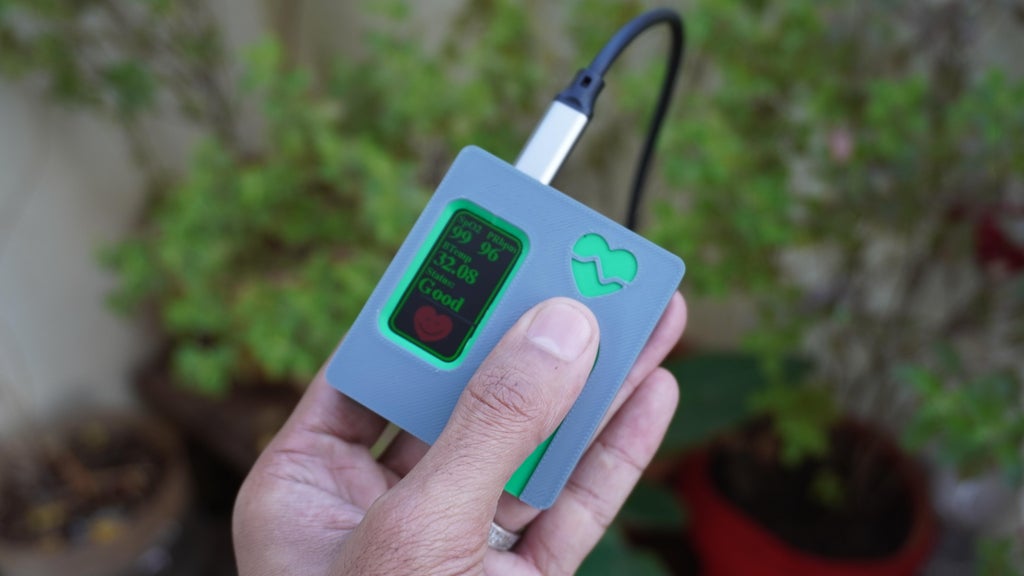
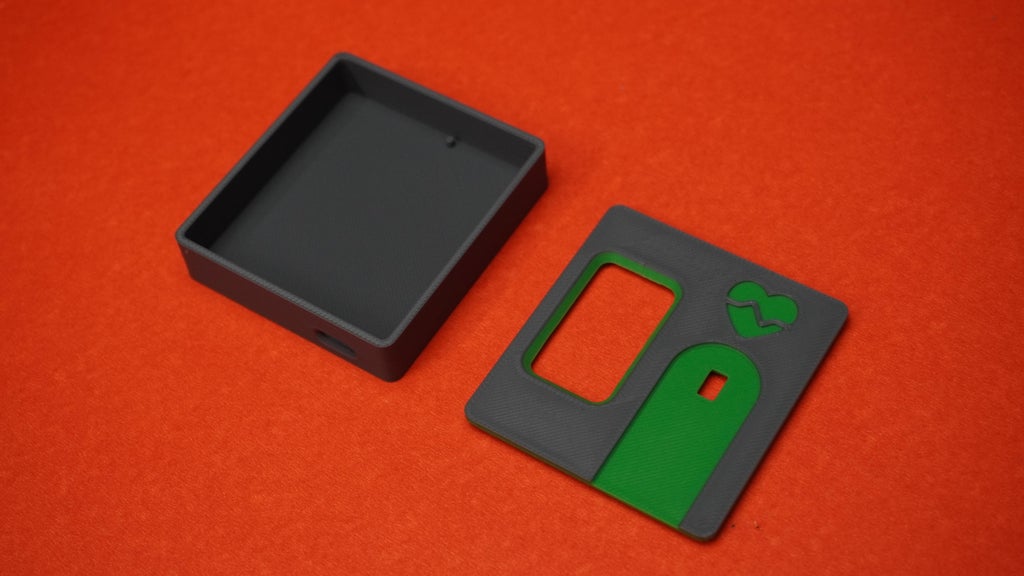
 First, I have designed this case and cover for our project by taking all the measurements of each component and importing the components whose 3D models were available.
You can download the design file and open it in Fusion 360 to modify it according to your needs, or you can download STL files and 3D print them:
1x housing.stl
1x cover.stl
I have 3D printed the housing in dark gray color and the cover in a dual-color tone, dark gray and green, by using the filament change technique, pausing the print in between.
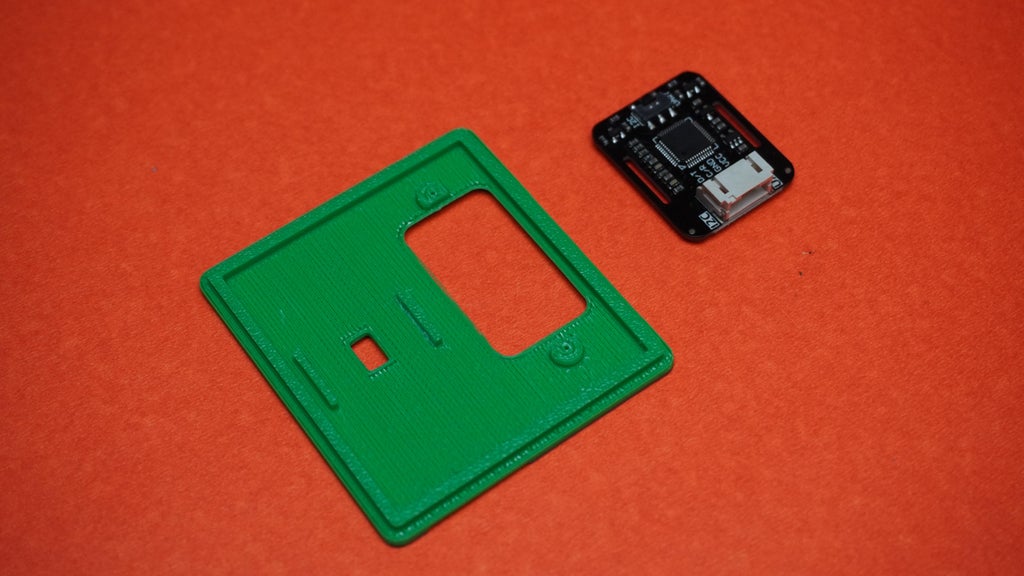


 First, I took the SPO2 heart rate sensor and mounted it on the 3D-printed cover by snapping the sensor into its designed location.
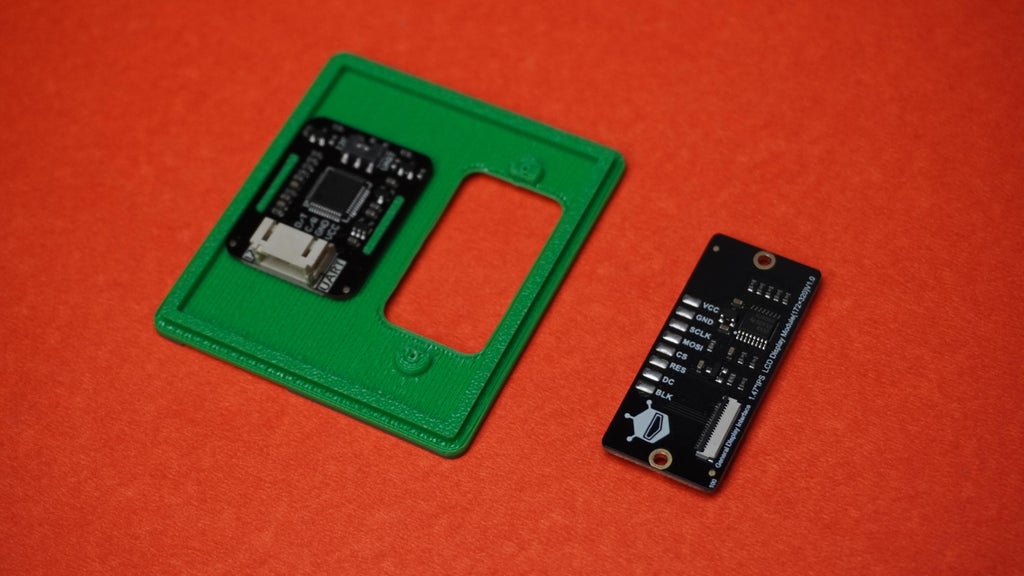

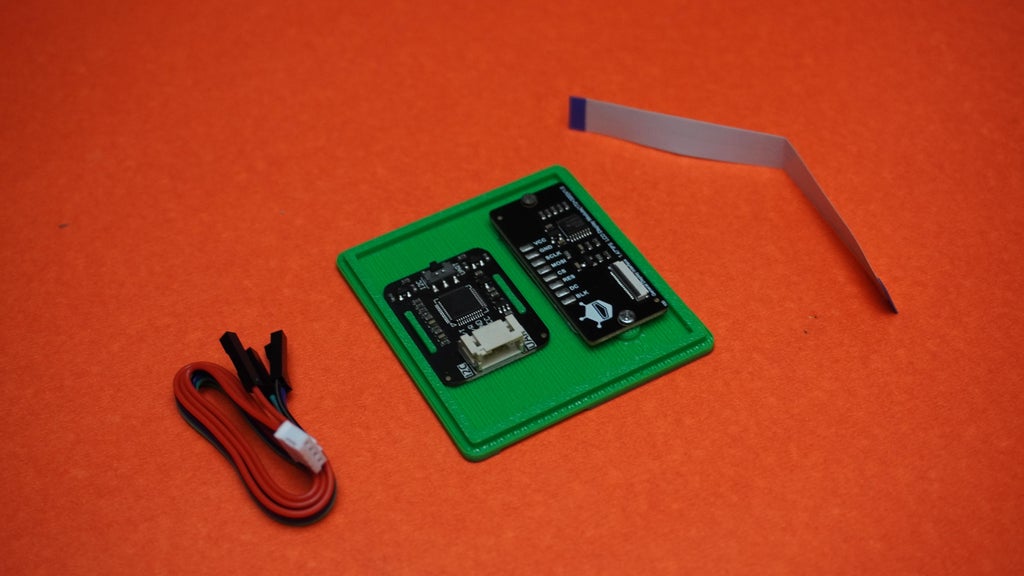
 Then, I took the display module and, using two M2 screws, mounted it to the cover in its designed position. Make sure to keep the orientation in mind during assembly.
'
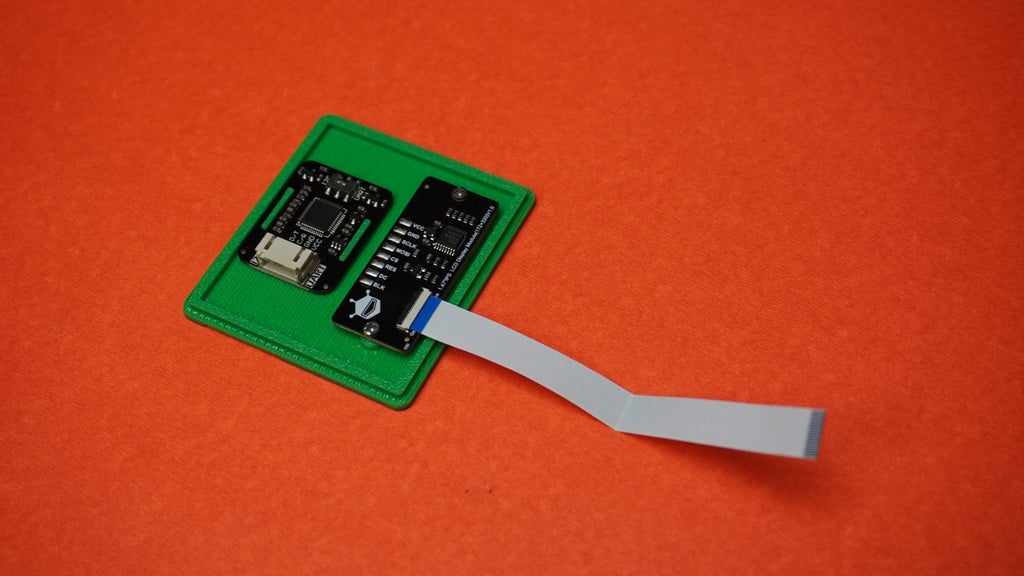
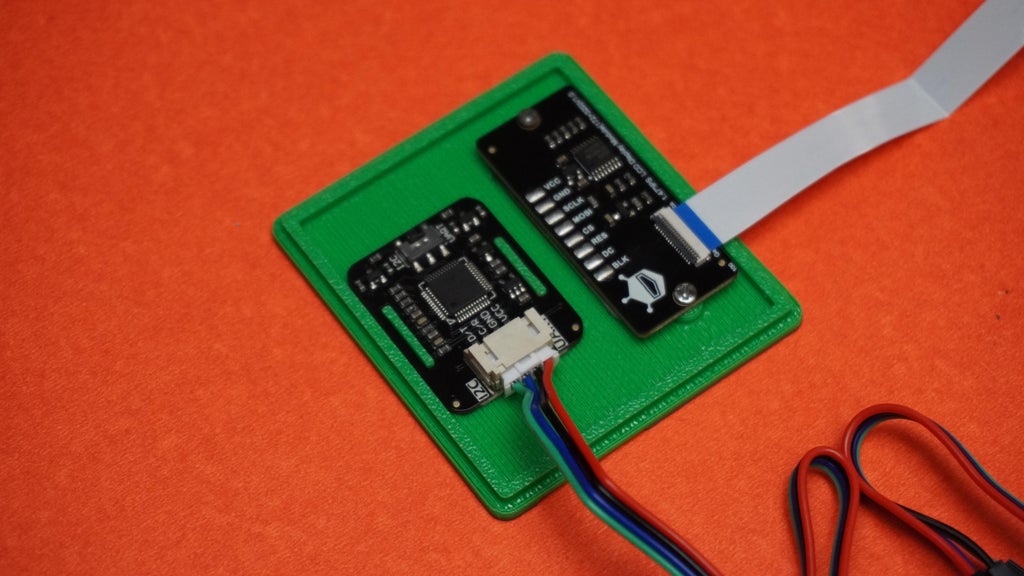
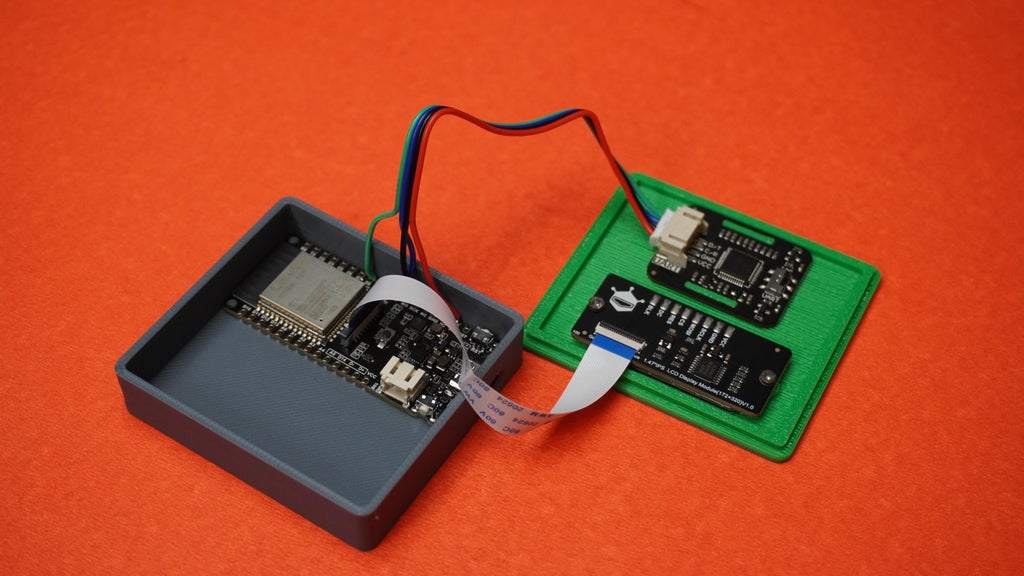
 Now, let's connect the GID ribbon cable to the display and connect the sensor cable as well.
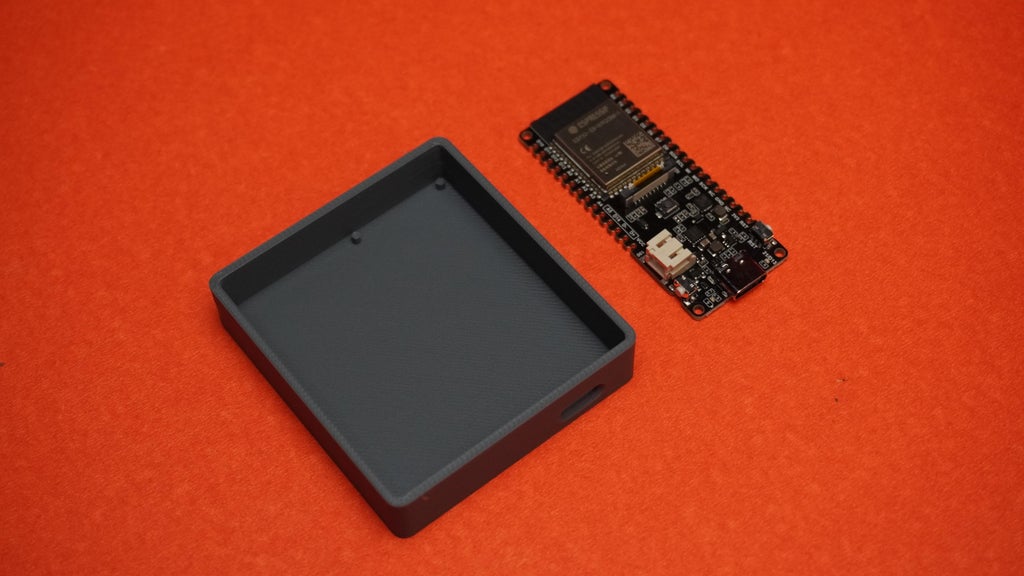
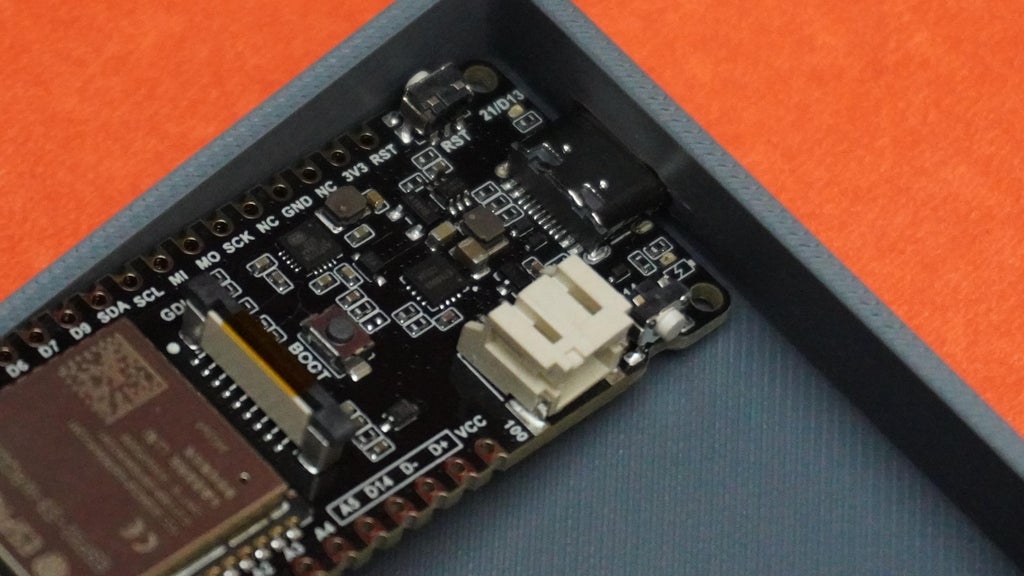
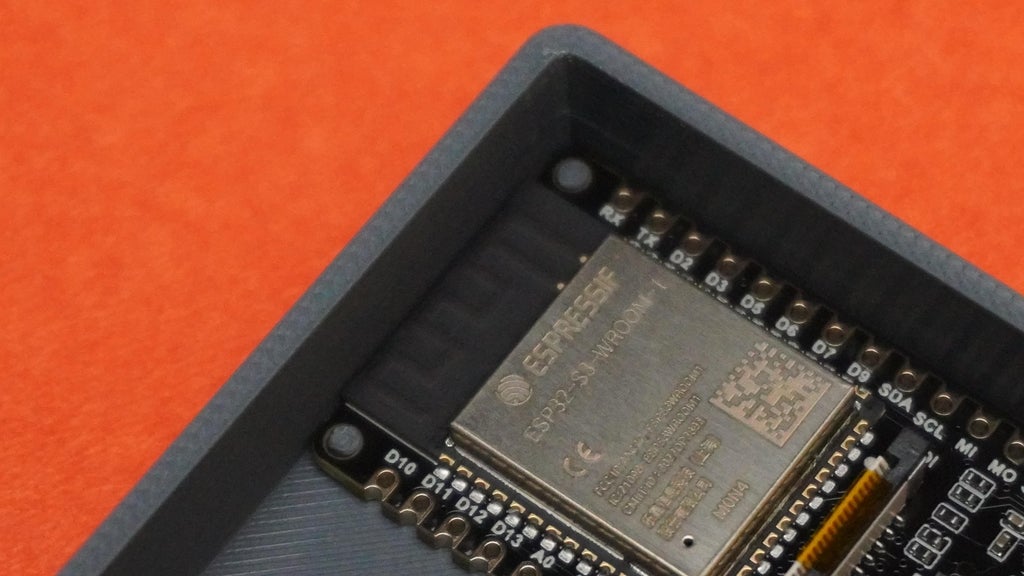
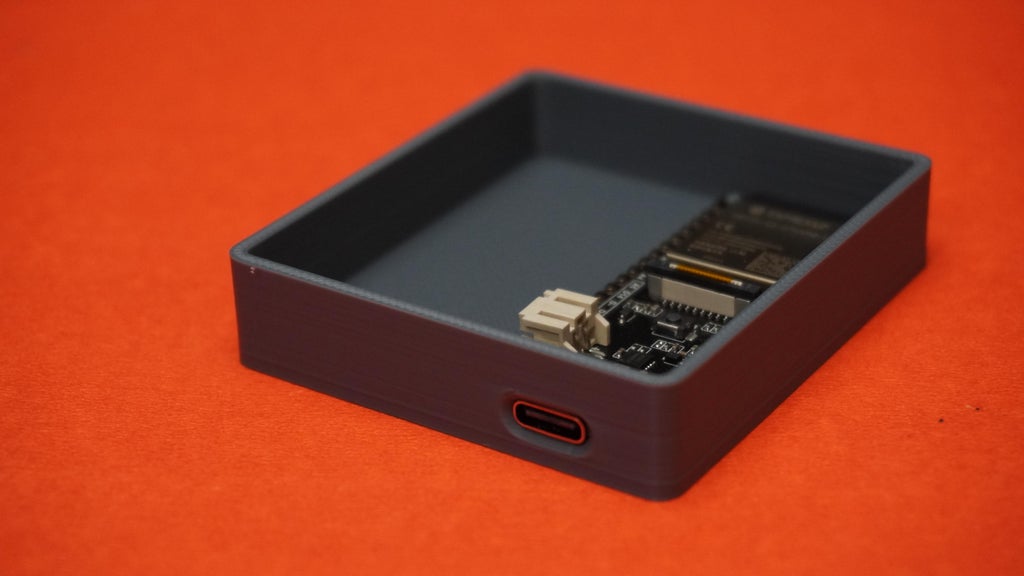
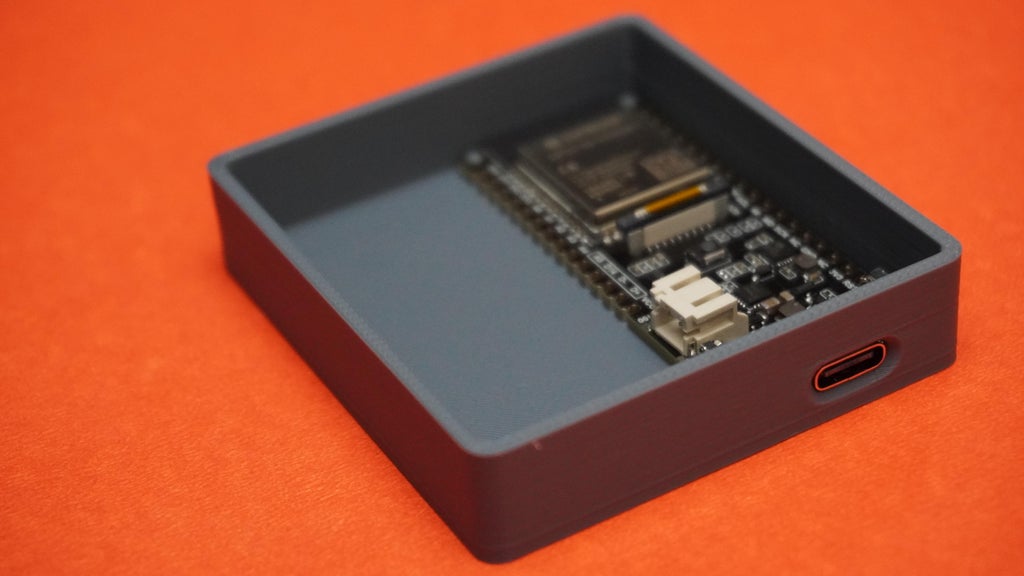
Now, take the housing and the ESP32, position the Type-C port with the designed slot on the housing, and snap it into place at the back as shown in the image.
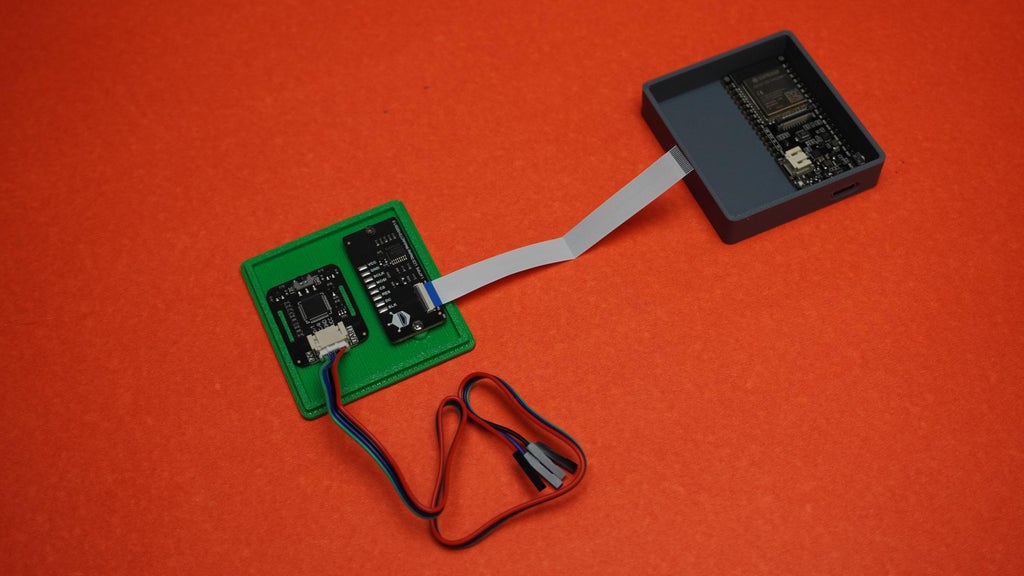
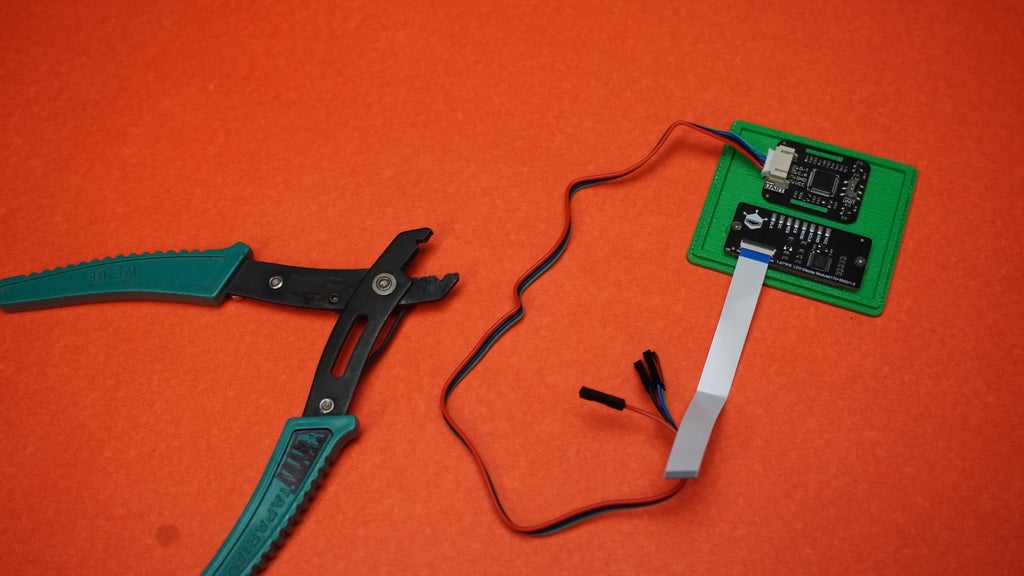
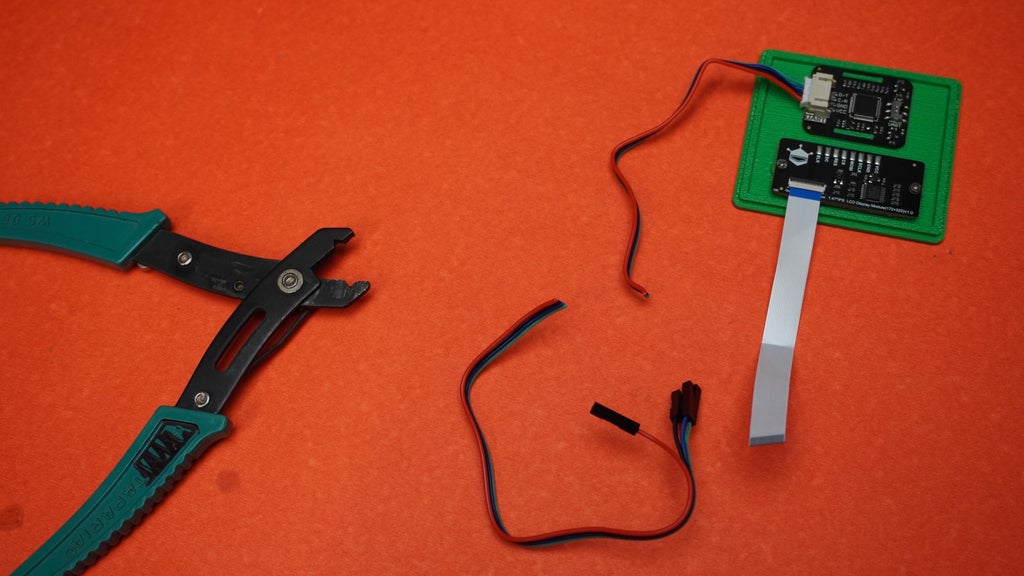
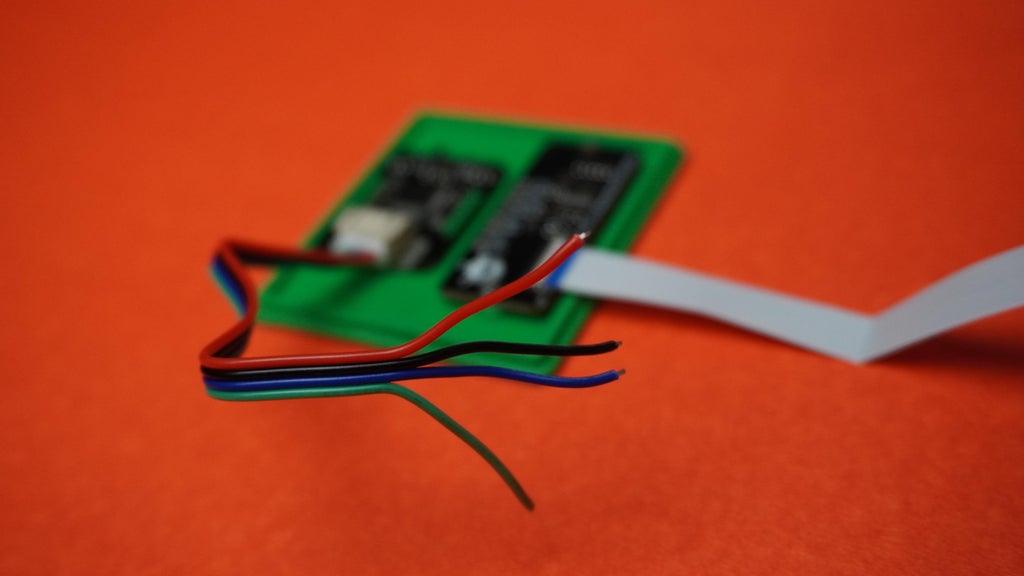
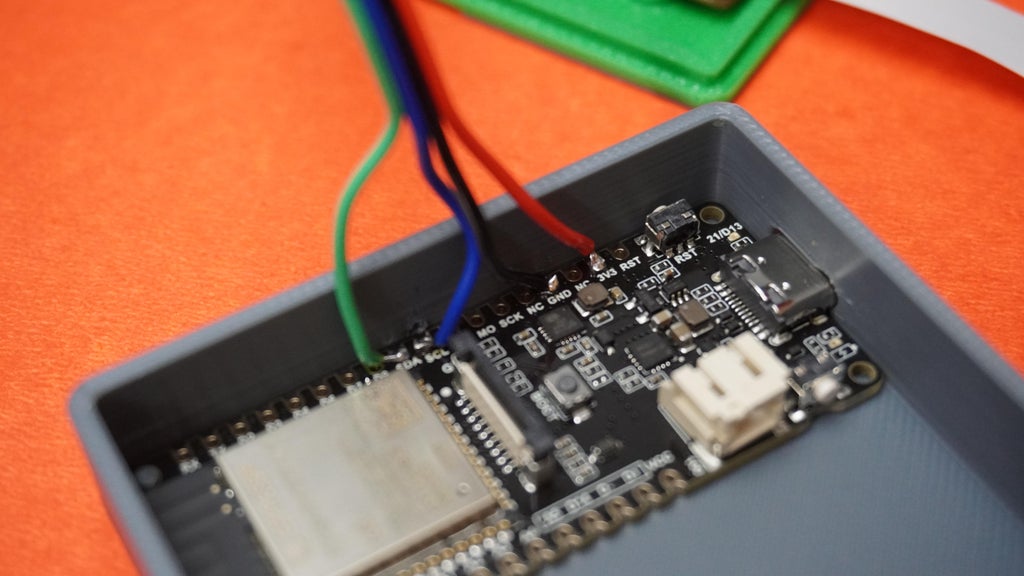
Connect the sensor to the ESP32 using the cable we connected earlier
Solder the wires in place.
Connect the SCL pin of the sensor to SCL on the ESP32.
Connect the SDA pin of the sensor to SDA on the ESP32.
Connect VCC (sensor) to 3V3 on the ESP32.
Connect GND (sensor) to GND on the ESP32.
Connect the GDI connector to the corresponding connector on the ESP32.


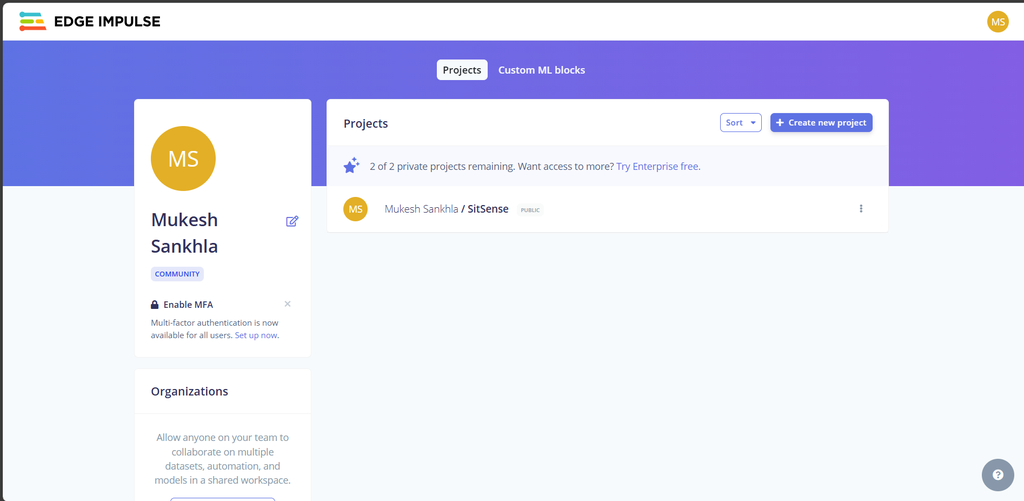
Go to edgeimpulse.com and log in to your account.
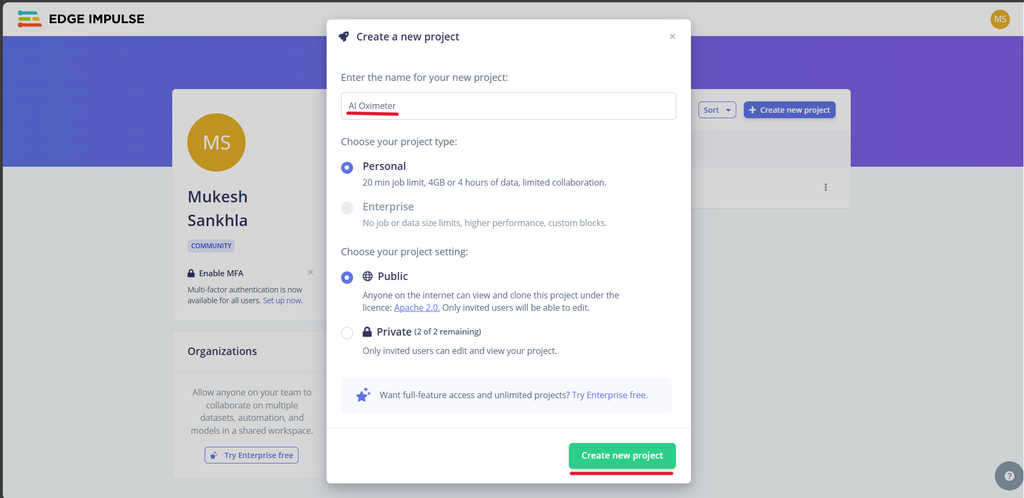
Click on "Create new project."
Enter a name for your project.
Choose whether to keep your project Private or Public.
Click on "Create."
 Understanding the Data Acquisition Panel:
The Data Acquisition panel in Edge Impulse allows you to upload data, collect data from a connected device, and manage your datasets.
You can upload data from CSV files, use built-in tools for live data collection, or import pre-recorded datasets.
Downloading Data from Kaggle:
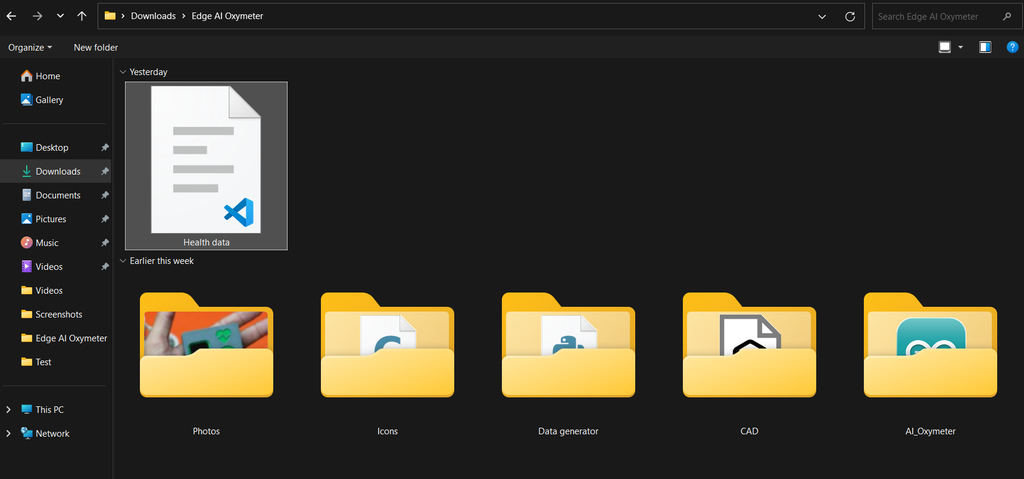
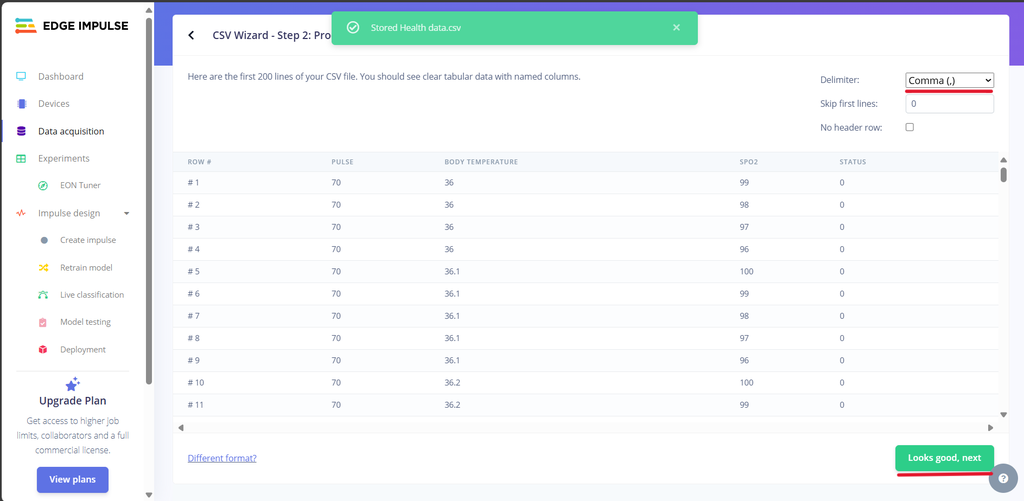
Since we have no data initially, I downloaded Health Data from kaggle.com containing SpO2, Heart Rate, Body Temperature, and a Status label.
Importing CSV Data:
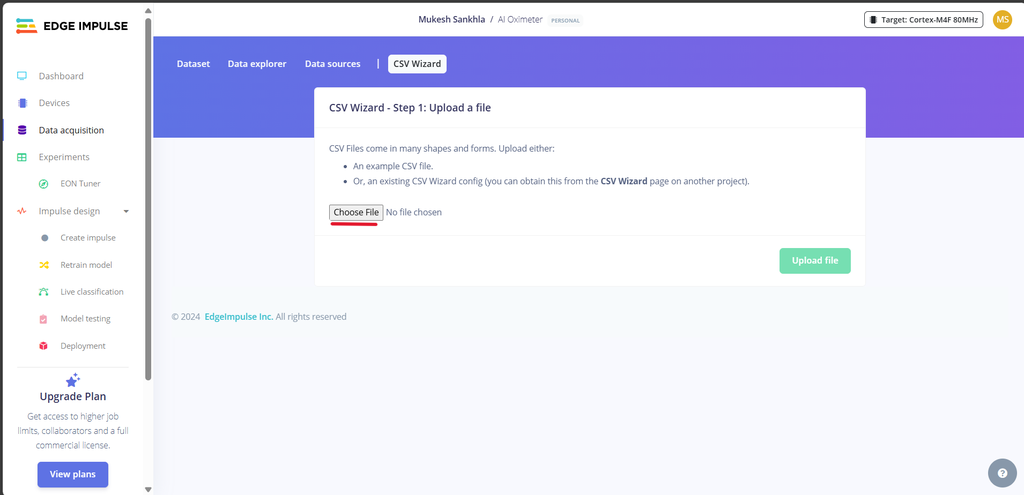
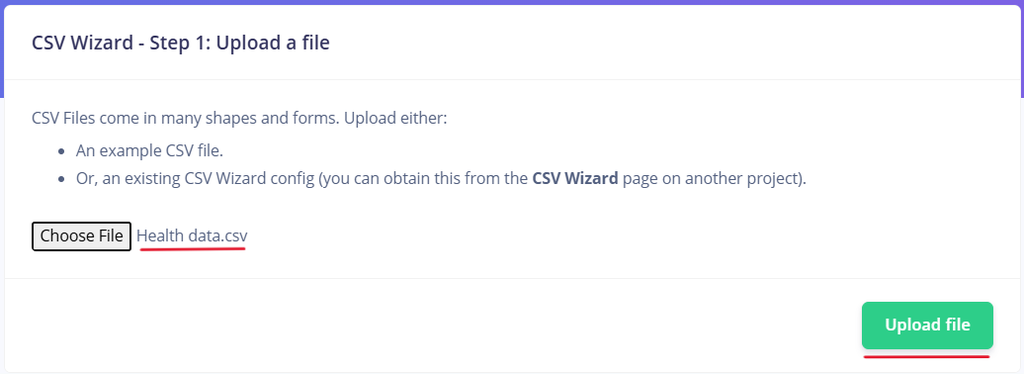
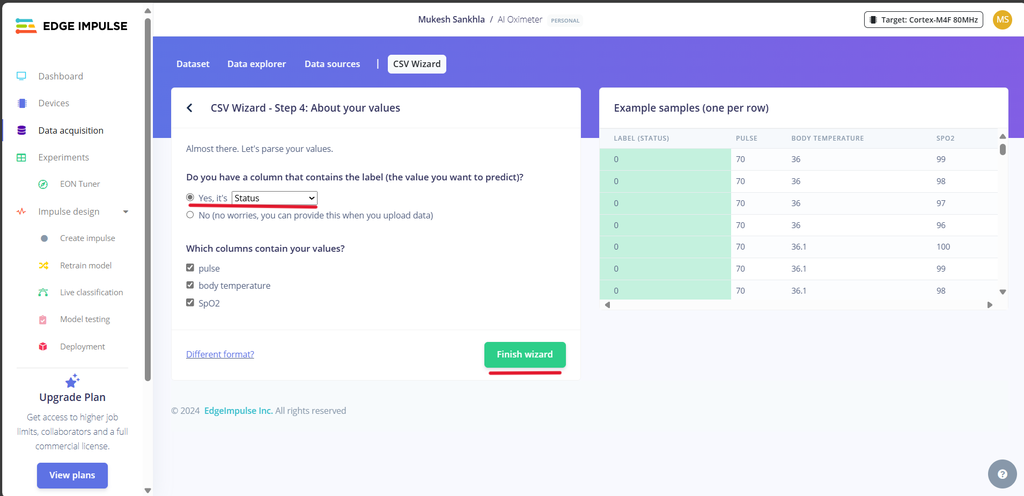
Go to "CSV Wizard" in the Data Acquisition panel.
Upload the Health Data.csv file you downloaded.
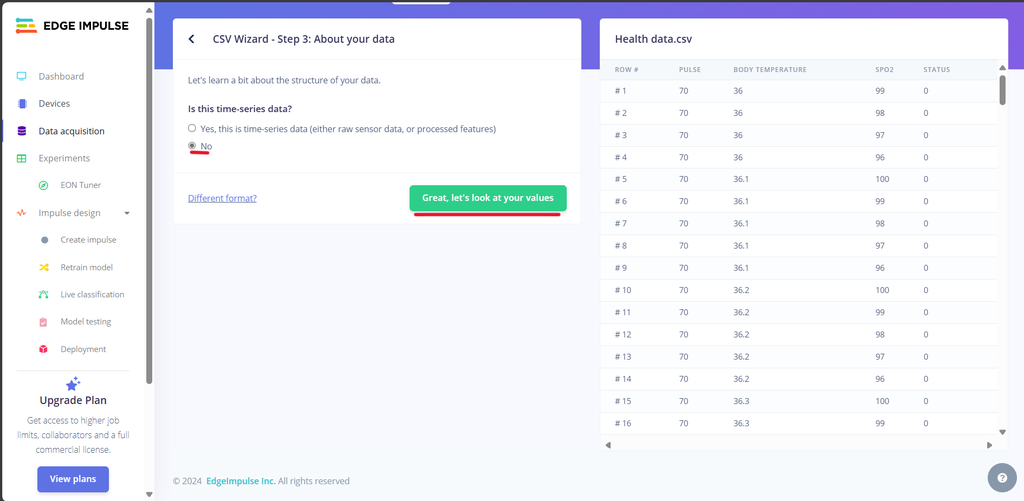
Set "Is this time series data?" to No.
Choose "Status" as your Label.
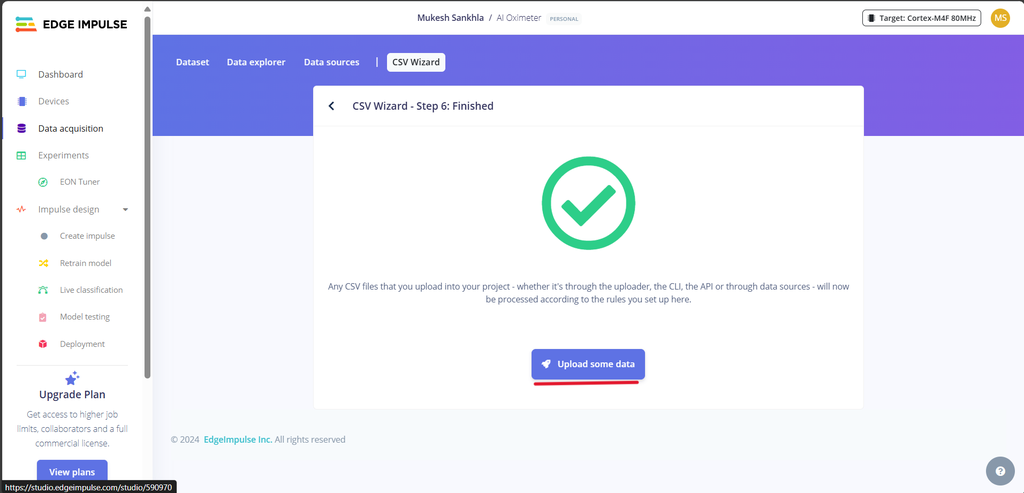
Click on "Finish Wizard."
Splitting Data:
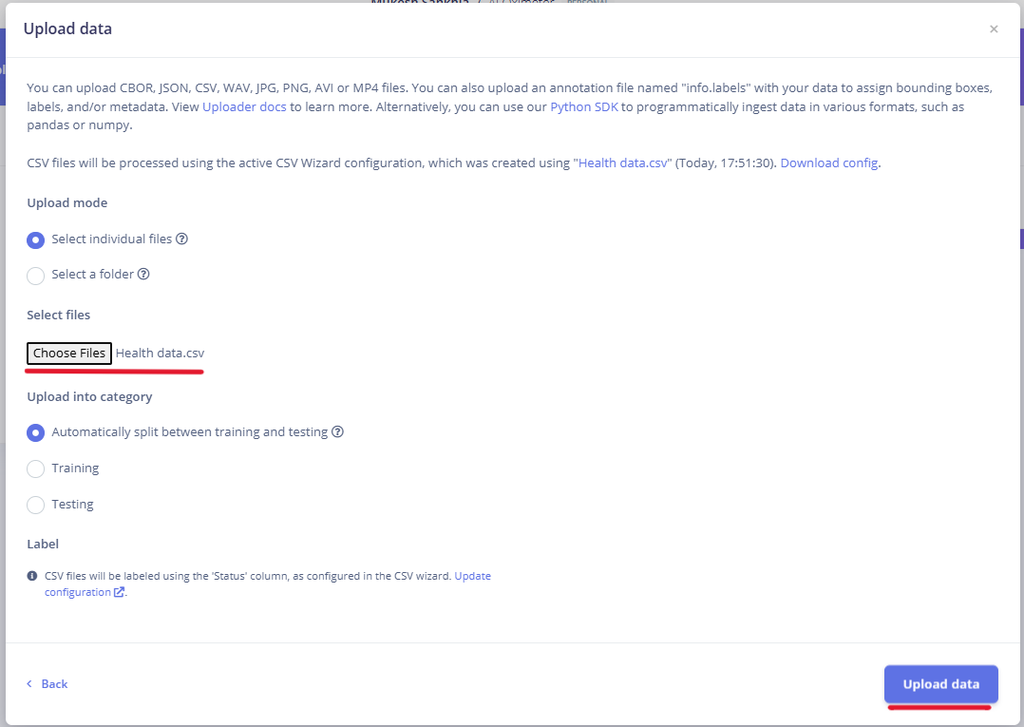
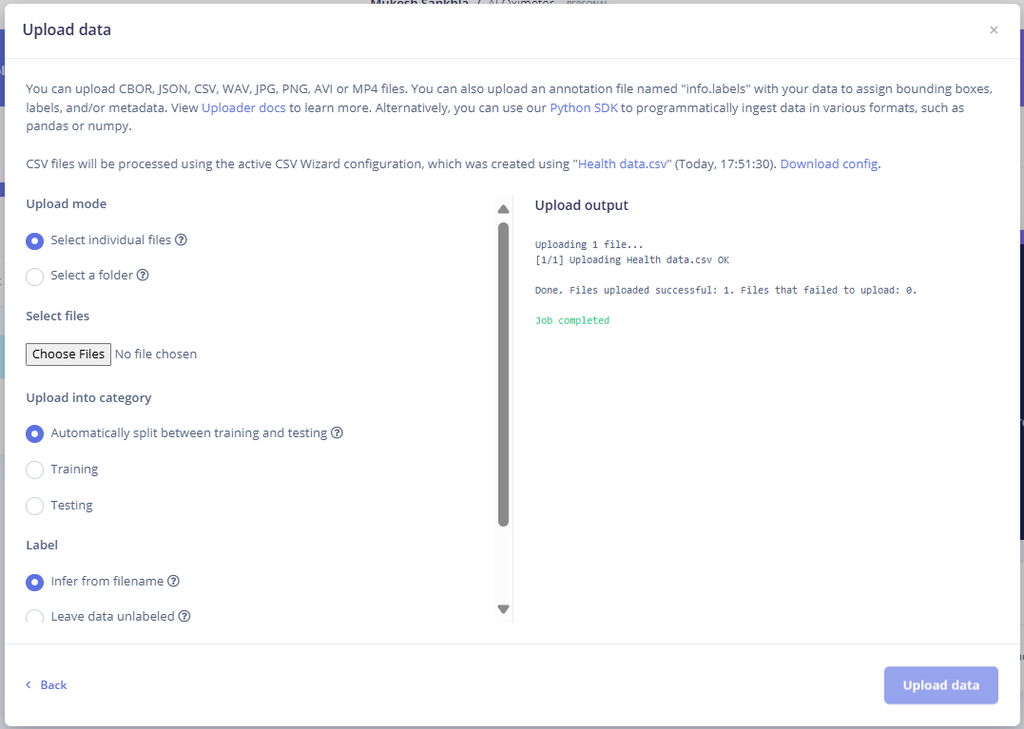
Upload the Health Data.csv again.
Check the box for "Automatic split between training and testing."
If your data is already separated, upload them manually to Training and Testing datasets.
Dataset Overview:
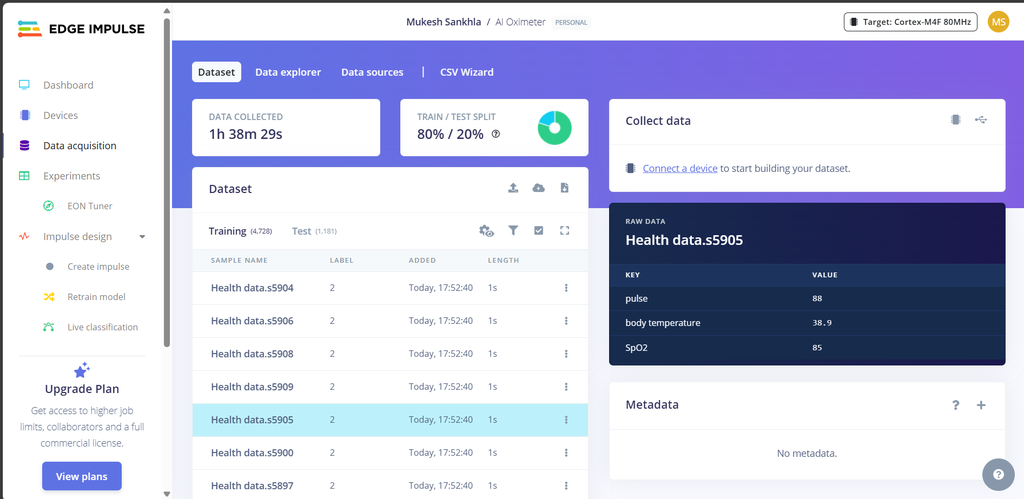
Once uploaded, you’ll see your data listed in the Dataset tab.
Ensure your data is split in an 80-20% ratio between Training and Testing.
The more diverse and accurate data you collect, the better your model will perform.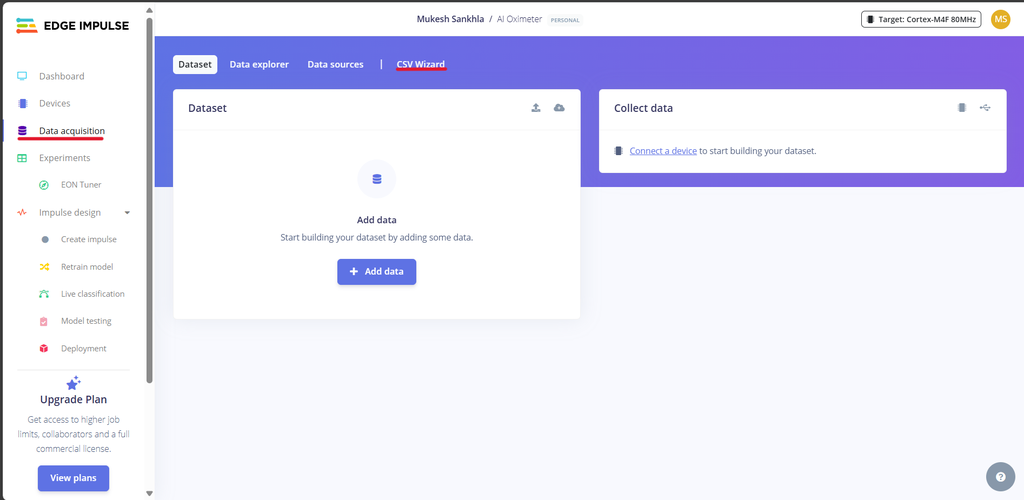
 Accessing the EON Tuner:
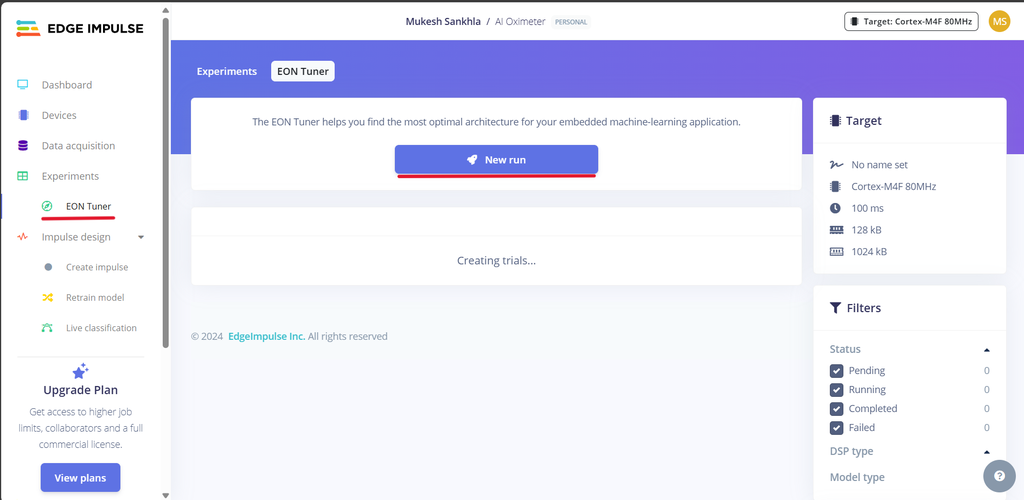
Navigate to the EON Tuner panel within your Edge Impulse project.
Click on New Run, then select Use Template.
Choose the Motion Events template.
(This choice is based on the use case where the model needs to classify different motion patterns, such as gestures or physical activities.)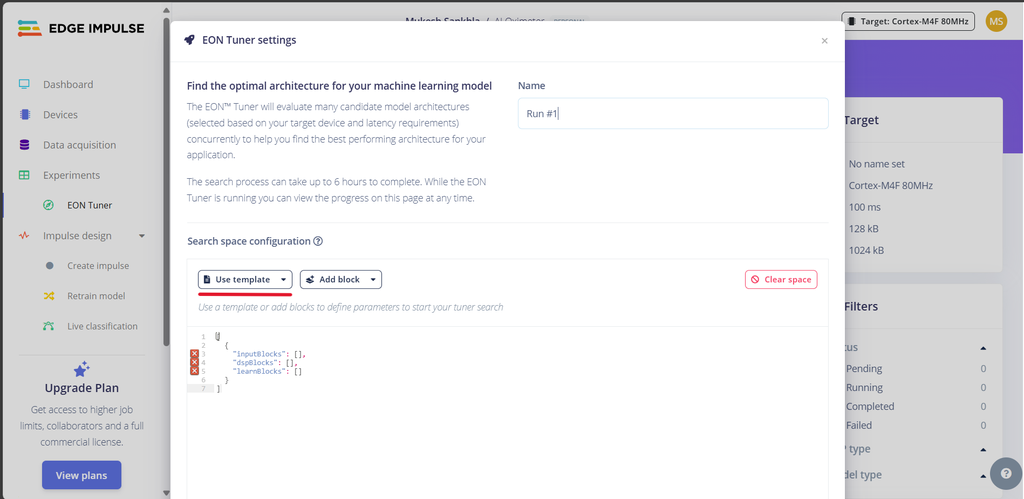
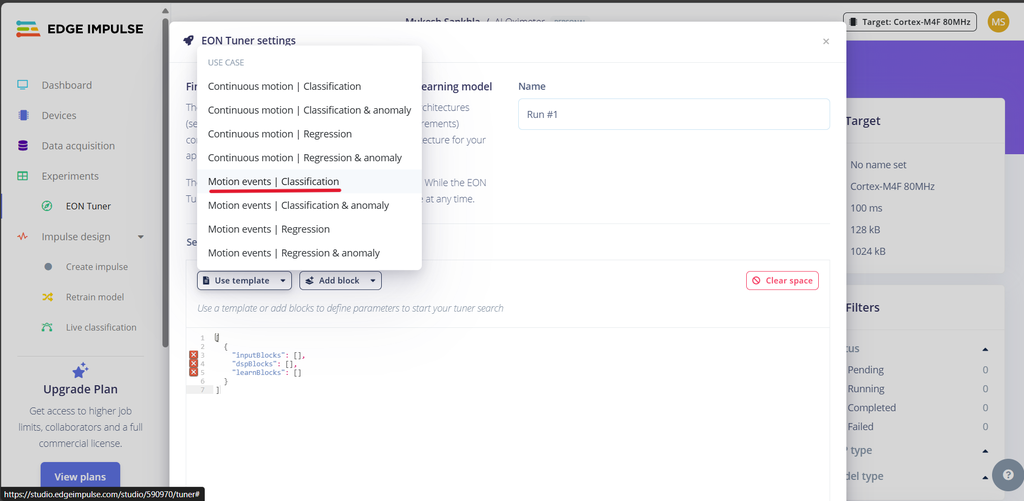
 Finally, click Start Tuner.
The EON Tuner will begin optimizing your model's architecture to find the best balance between performance, accuracy, and resource usage. This process may take some time, as it tests multiple model configurations. Once complete, it will list the results, with the best-performing configurations displayed at the top and the less-optimal ones at the bottom.
Understanding the Results: The EON Tuner displays key metrics for each model configuration, such as latency, RAM, ROM, and overall accuracy. Below is a general explanation of the images and metrics:
Model Configurations: Each card represents a different model architecture.
For example, the three shown in the images are labeled raw-dense-872, raw-dense-605, and raw-dense-75c.
Performance Metrics:
Latency: Time taken for the model to make a prediction. In these examples, all models have a latency of 1ms, meaning they're very fast.
RAM: Memory required to run the model. More compact models use less RAM, as seen in the third model (1 kB).
ROM: Storage size of the model. Again, smaller models like the third one are more efficient, with 15 kB usage compared to 16 kB.
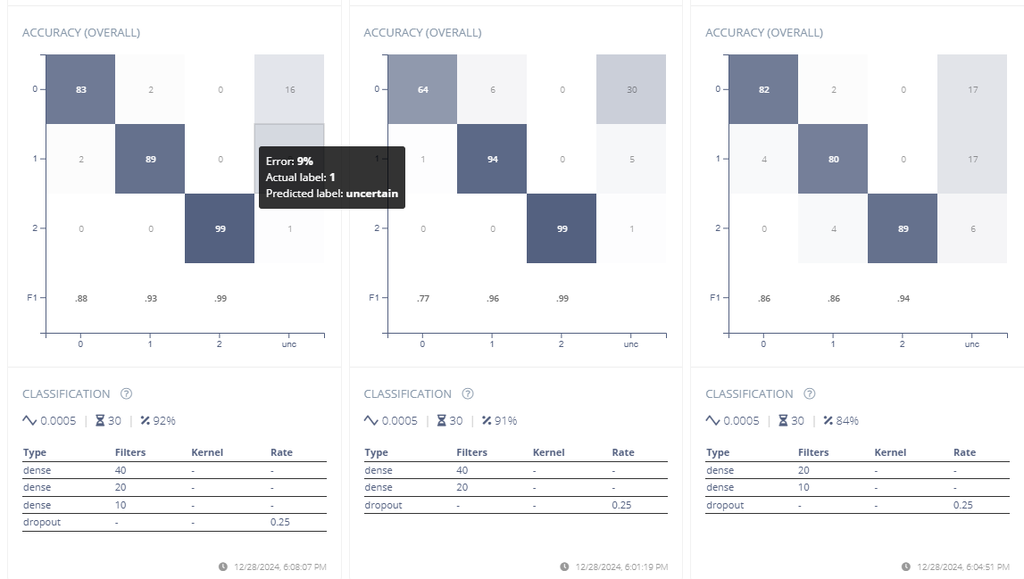
Accuracy and Confusion Matrices: Each card includes a confusion matrix to illustrate how well the model performs across different classes:
The diagonal values represent correct classifications.
Off-diagonal values represent misclassifications.
The darker the diagonal cells, the better the model’s performance.
F1 Score: Combines precision and recall into a single metric, shown for each class. Higher F1 scores indicate better performance.
Selecting the Best Model:
In this example, raw-dense-872 has the highest accuracy (92%), with strong performance across all metrics (e.g., F1 scores above 0.88).
If resource constraints (RAM or ROM) are more critical, a smaller model like raw-dense-75c (84% accuracy) might be a better choice despite lower accuracy.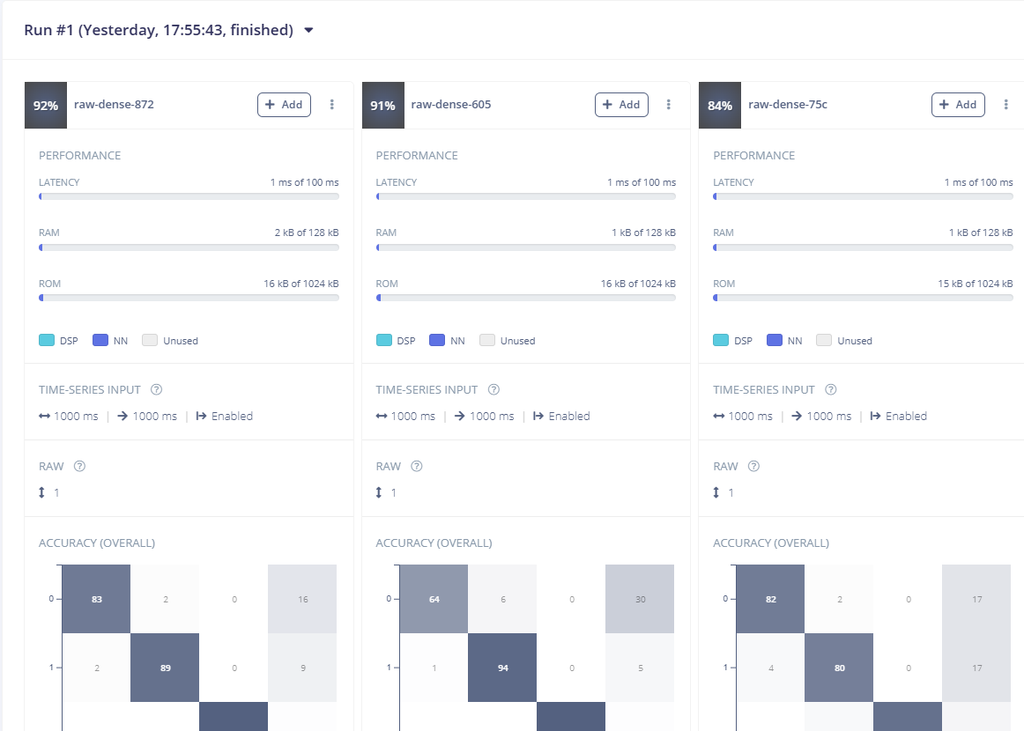
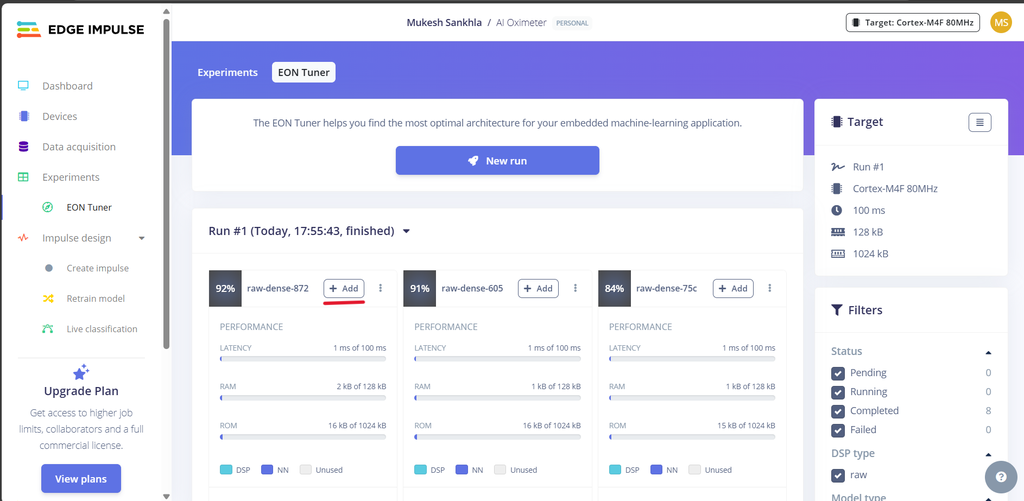
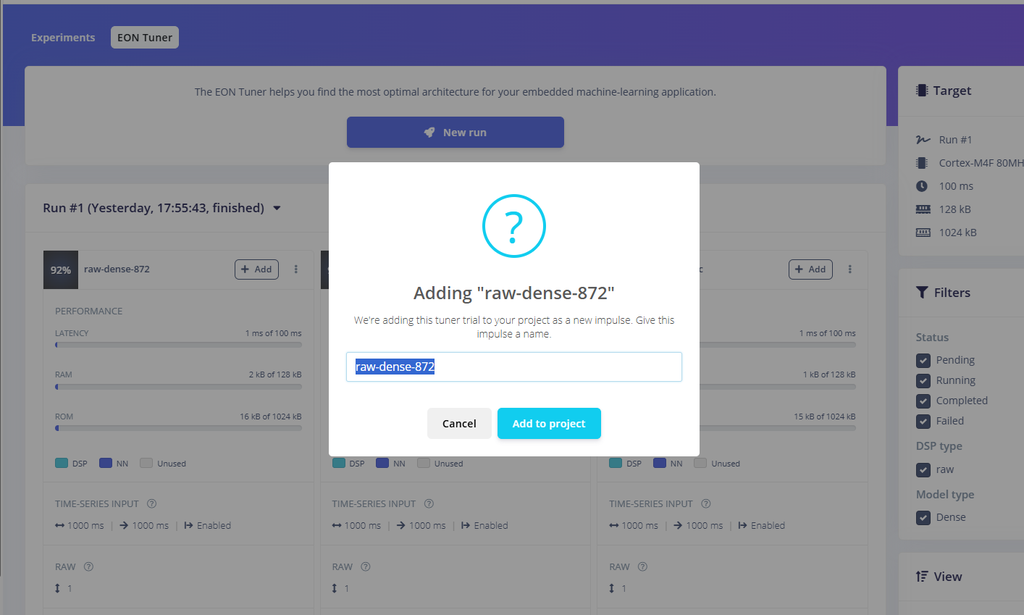 Once you've identified the most suitable model, click on Add to integrate it into your Edge Impulse project for deployment.
Edge Impulse automatically creates the complete impulse for you, which includes the following components:
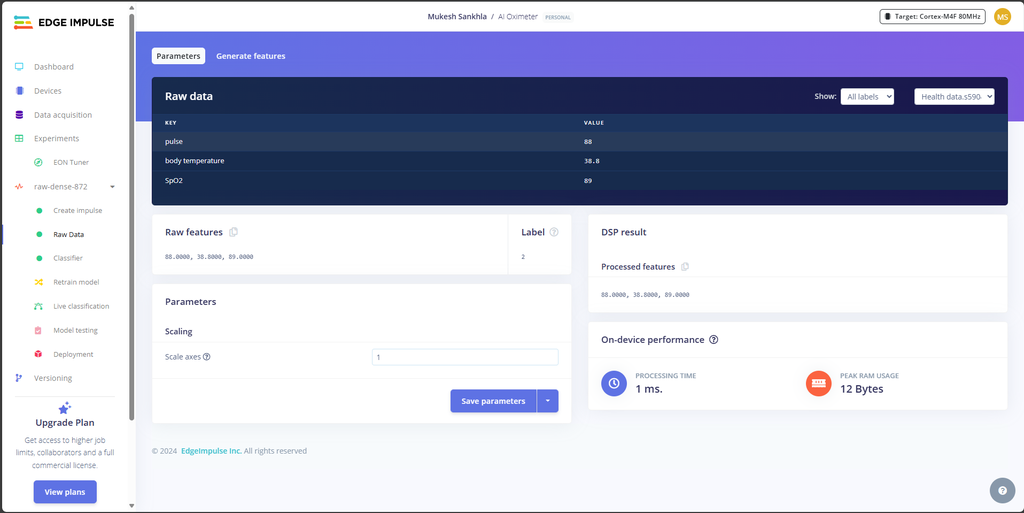
Raw Data Block: Configured to process your raw input data appropriately.
Feature Extractor/Processing Block: Optimized based on the selected model.
Classifier: The machine learning model itself, fine-tuned and ready for deployment.
If you don't use the EON Tuner:
Without the EON Tuner, you would need to manually configure each step in the pipeline, including:
Defining the raw data processing block (e.g., windowing or filtering).
Choosing and tuning the feature extractor (e.g., Fourier transform, spectral analysis, etc.).
Selecting the classifier architecture and adjusting its hyperparameters based on your understanding of machine learning.
This manual process requires a deeper understanding of data processing and model design, and it often involves a trial-and-error approach. You can check my previous project SitSense for better understanding.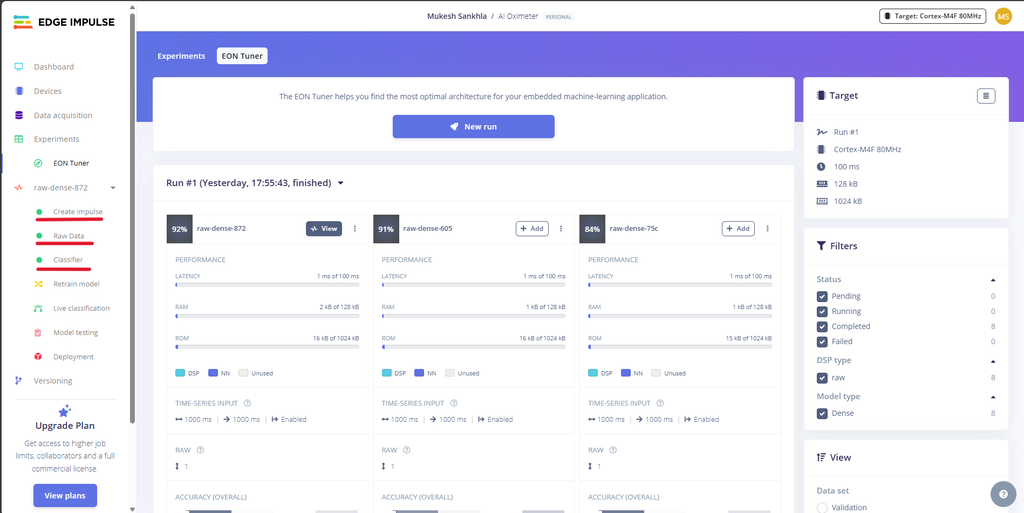
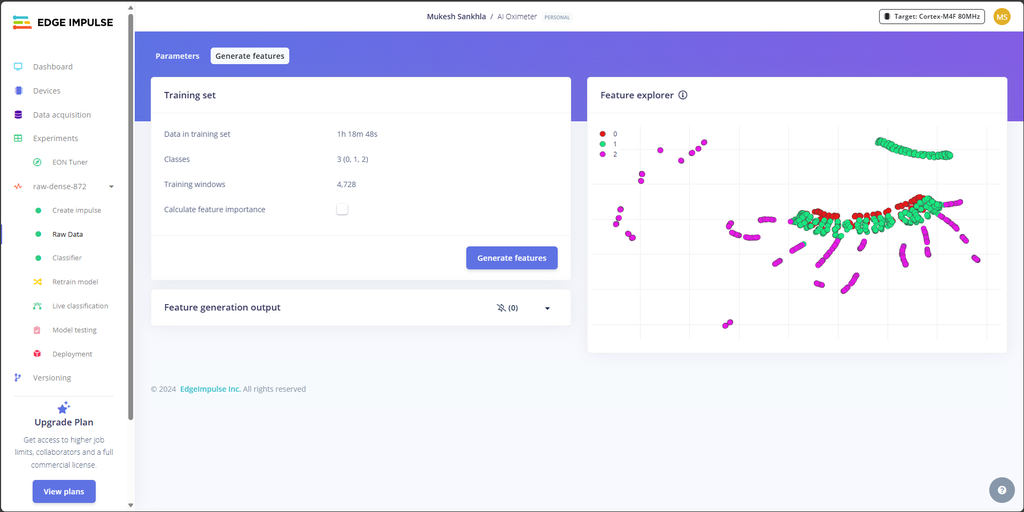
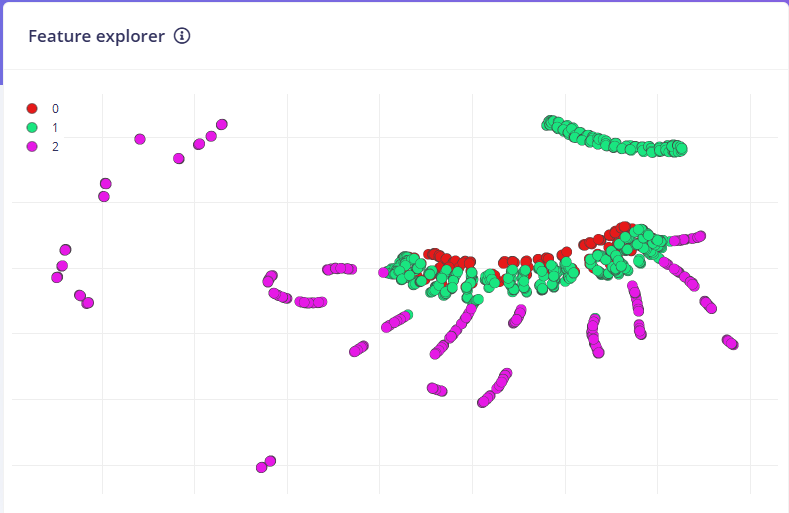 Visual Analysis: The feature explorer graph shows three clearly separated clusters (red, green, purple), suggesting good model differentiation between classes. The data appears well-distributed, with:
A curved green cluster at the top
Mixed red and green points in the middle
Purple points scattered along the bottom
This visualization suggests a successful segmentation of the health monitoring data (pulse, temperature, SpO2) into three distinct categories, which is promising for classification accuracy.
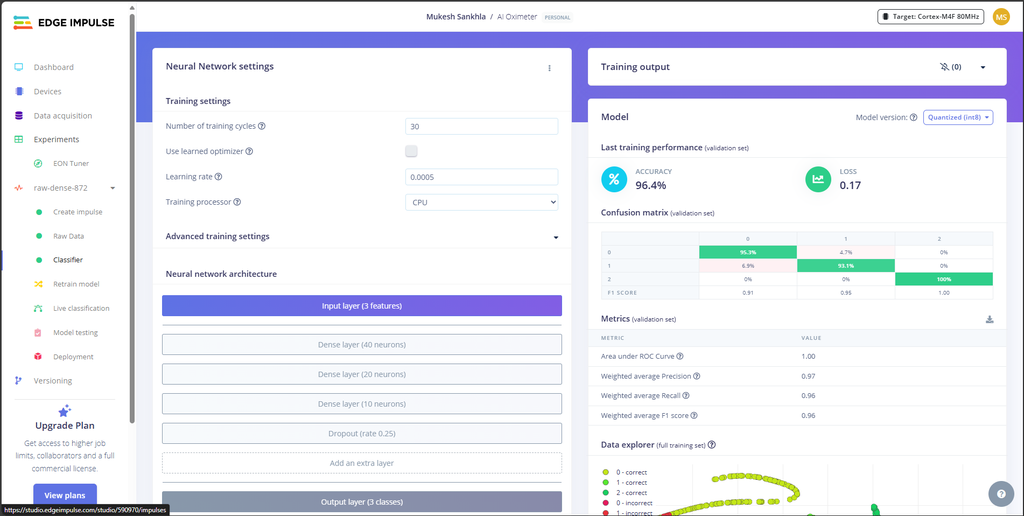
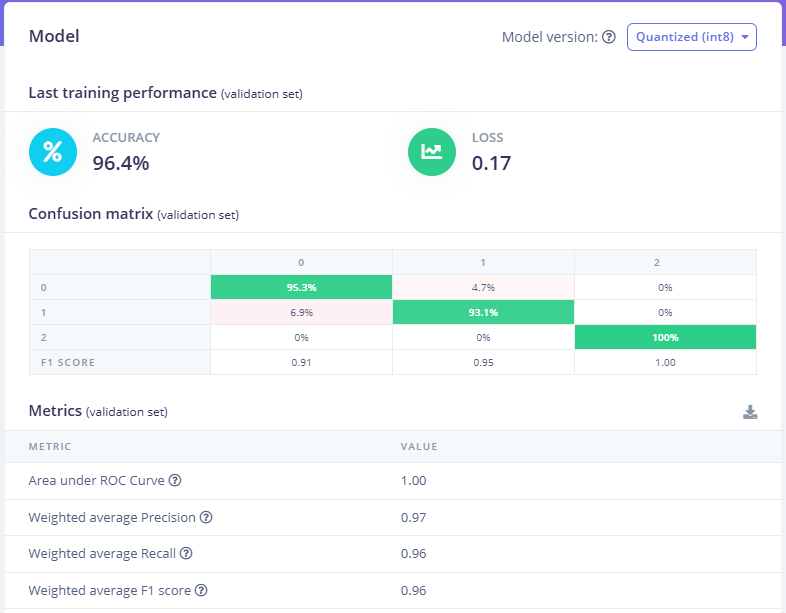
 Performance:
96.4% overall accuracyVery low loss (0.17)Perfect F1 score (1.00) for Class 2Strong confusion matrix scores (95.3%, 93.1%, 100% diagonal)
Device Requirements:
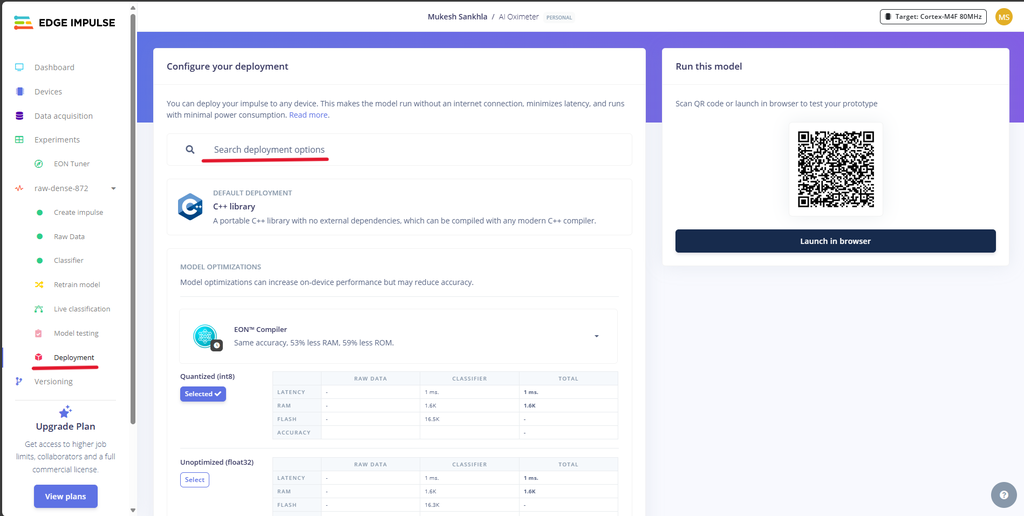
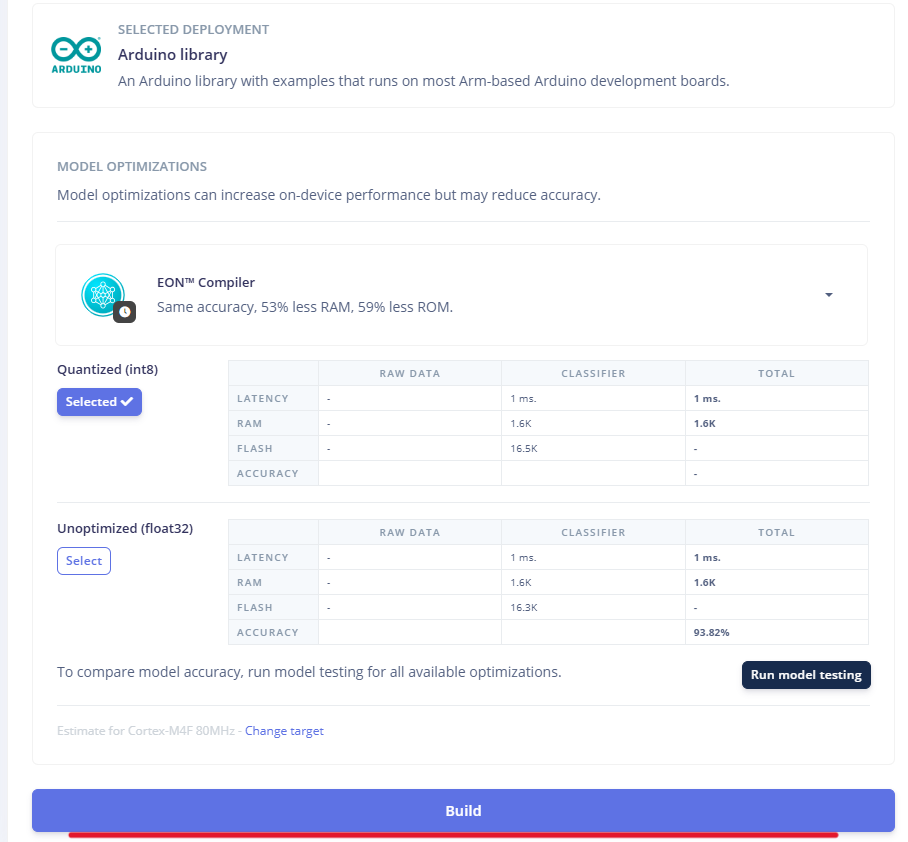
Fast inference: 1msEfficient memory: 1.6K RAMCompact storage: 16.5K flash
The data explorer visualization shows mostly correct classifications (green dots), with minimal misclassifications (red dots) clustered in one small area, indicating robust model performance across different health states.
These metrics suggest a reliable, deployment-ready model suitable for resource-constrained health monitoring devices.
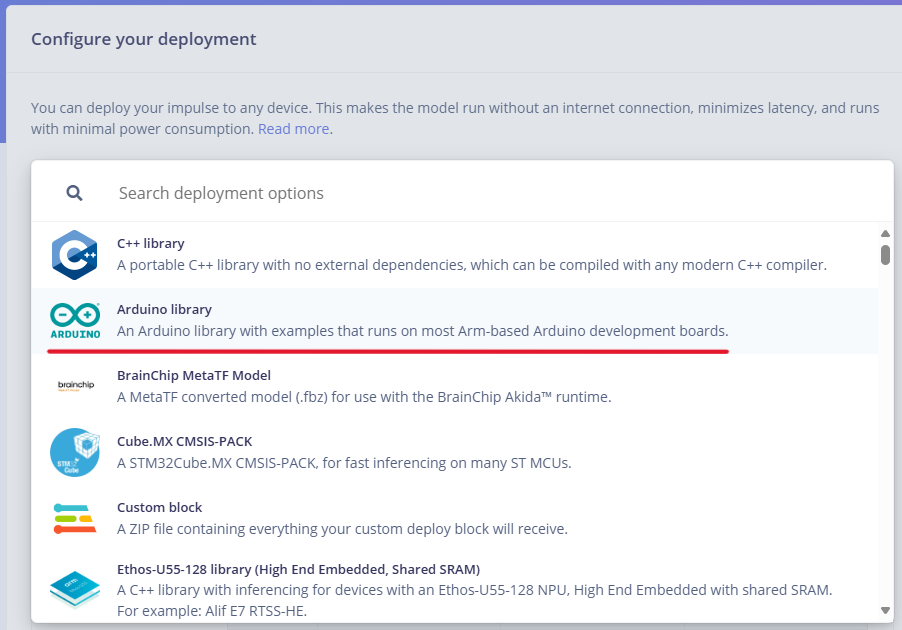
Go to the Deployment panel in Edge Impulse.
From the available deployment options, select Arduino Library.
Click on Build to compile the model as an Arduino library.
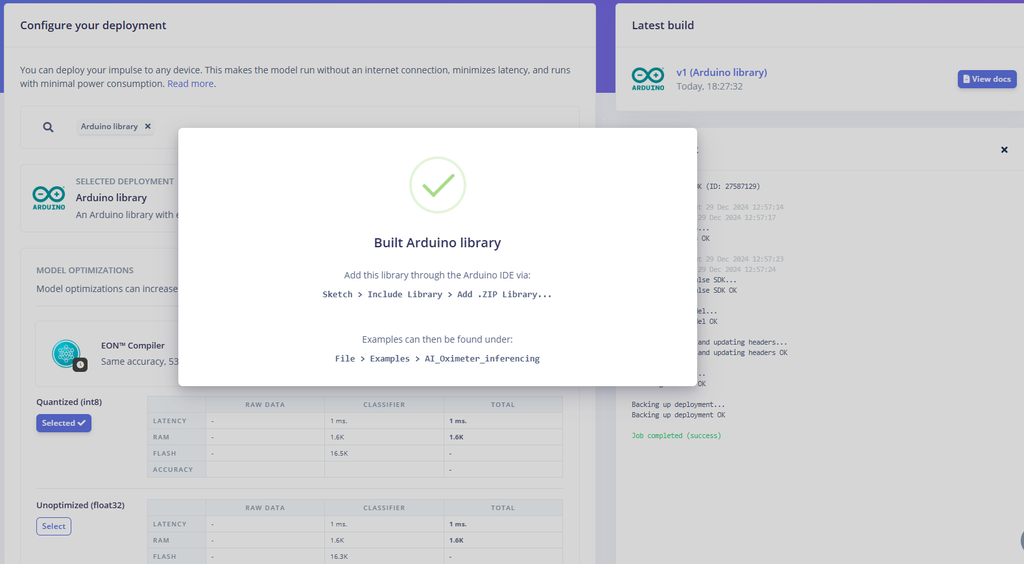
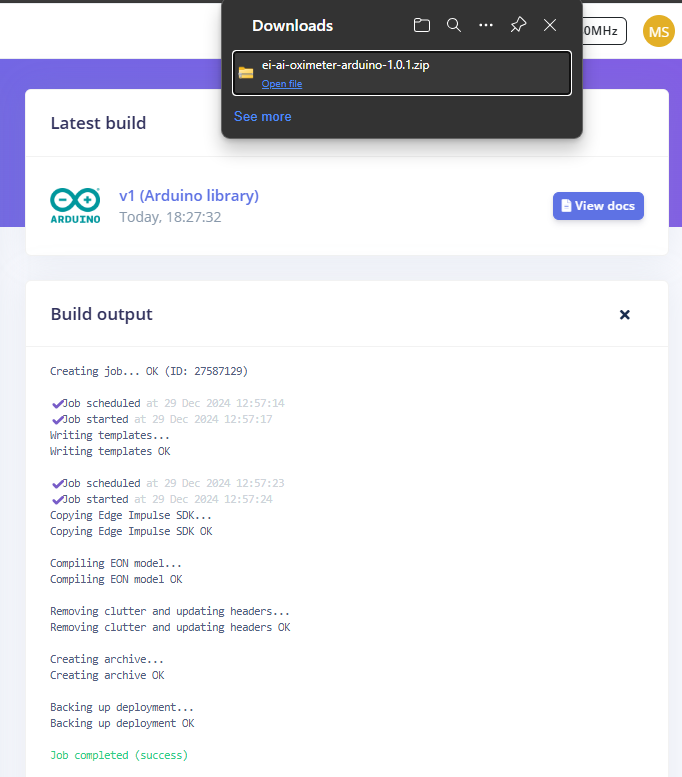
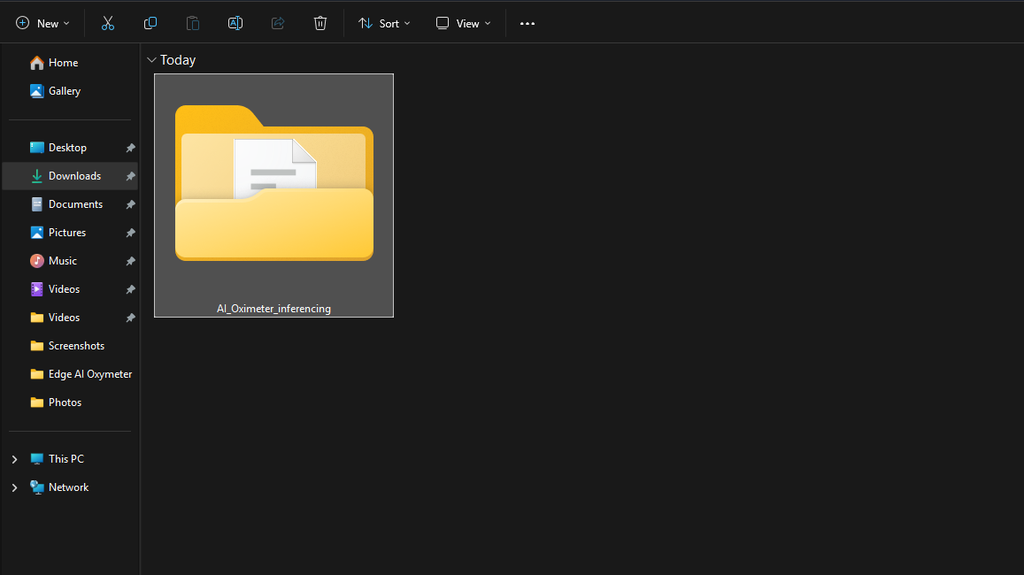
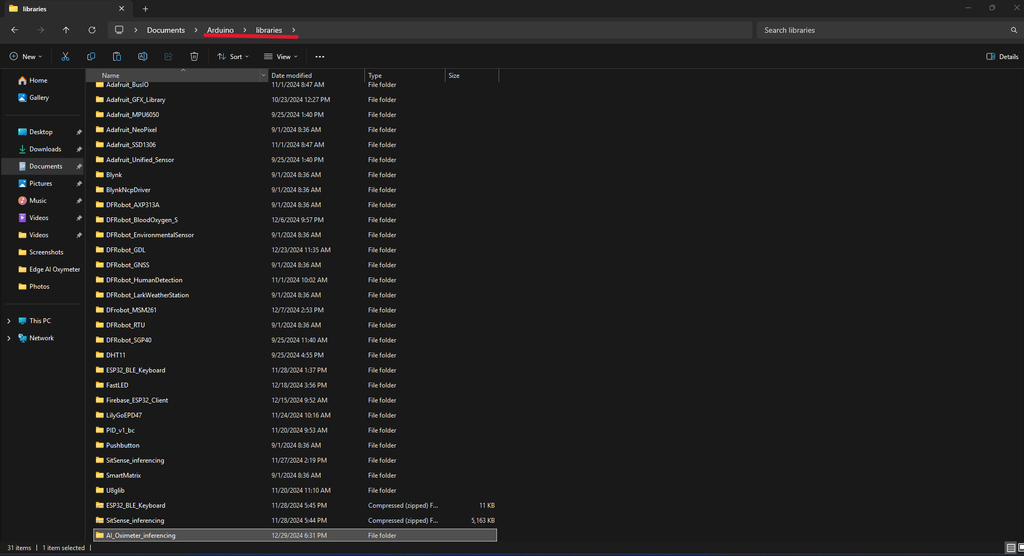
 Installing Edge Impulse Library:Once the build is complete, a ZIP file will be downloaded to your system.
Extract the ZIP file.
Copy the extracted folder and paste it into the Documents > Arduino > libraries folder on your computer.
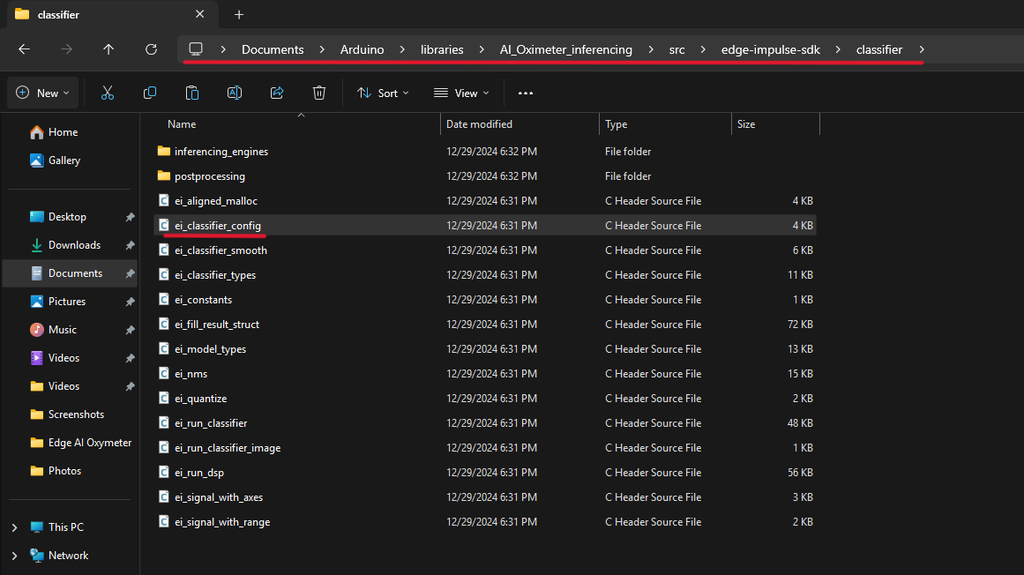
Modify the ei_classifier_config.h File:
Navigate to the following path inside the extracted library folder:
Documents\Arduino\libraries\SitSense_inferencing\src\edge-impulse-sdk\classifier\
Locate the file named ei_classifier_config.h.
Find the following line:
#define EI_CLASSIFIER_TFLITE_ENABLE_ESP_NN 1
Change the value from 1 to 0 as shown below:
#define EI_CLASSIFIER_TFLITE_ENABLE_ESP_NN 0
Why This Change Is Necessary:
The ESP-NN (Neural Network Acceleration) feature in TensorFlow Lite is designed to optimize performance on ESP32 devices.
However, this setting can sometimes cause compatibility issues with certain models or configurations.
Disabling it ensures the model runs reliably, even if it means sacrificing some performance optimization.
After making the change, save the file and close the editor.
Download and Install Libraries:
Download the RTU and Heart Rate Sensor libraries.
Open the Arduino IDE.
Ensure you have the ESP32 Board Manager installed.
If not, click here for the installation steps.
In the Arduino IDE, navigate to: Sketch > Include Library > Add ZIP Library.
Select the RTU library ZIP file to install it.
Repeat the process for the Heart Rate Sensor library ZIP file.
Download the AI_Oximeter GitHub repository.
Extract the ZIP file. This will include: The AI_Oximeter code, CAD files, The modified GDL Display Library.
Again, go to: Sketch > Include Library > Add ZIP Library.
Select the extracted GDL Display Library ZIP file to install it.
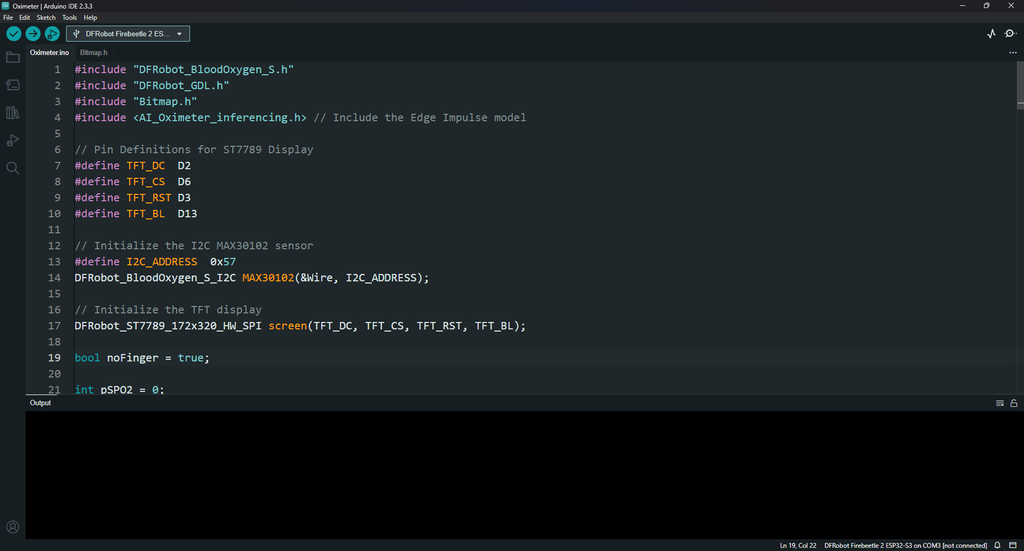
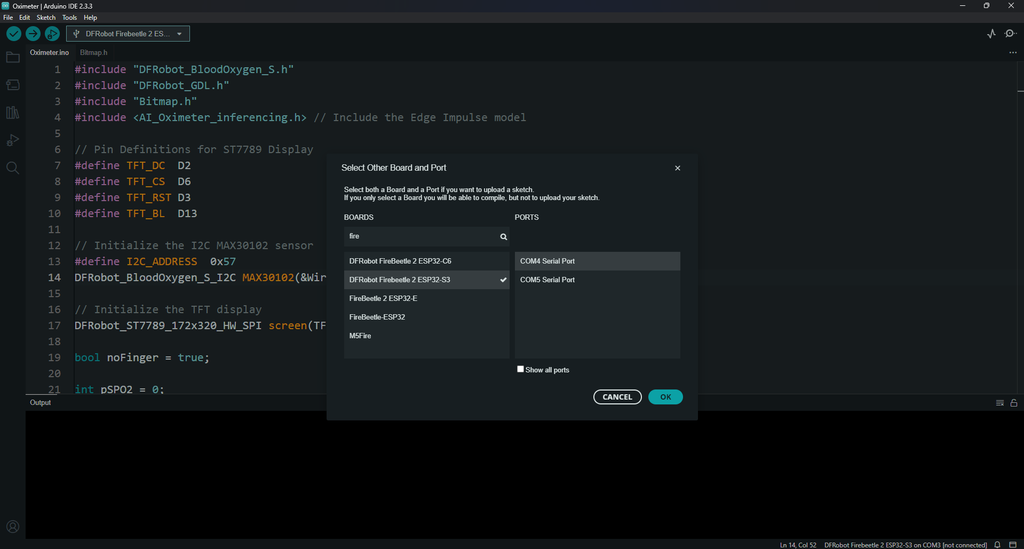
Open the Oximeter.ino file in the Arduino IDE.
Use a USB cable to connect your device to your PC.
In the Arduino IDE, go to Tools > Board and select: DFRobot FireBeetle-2 ESP32-S3.
Then, go to Tools > Port and select the COM port corresponding to your connected device.
Click on the Upload button in the Arduino IDE (the right-facing arrow icon).
Wait for the upload process to complete.
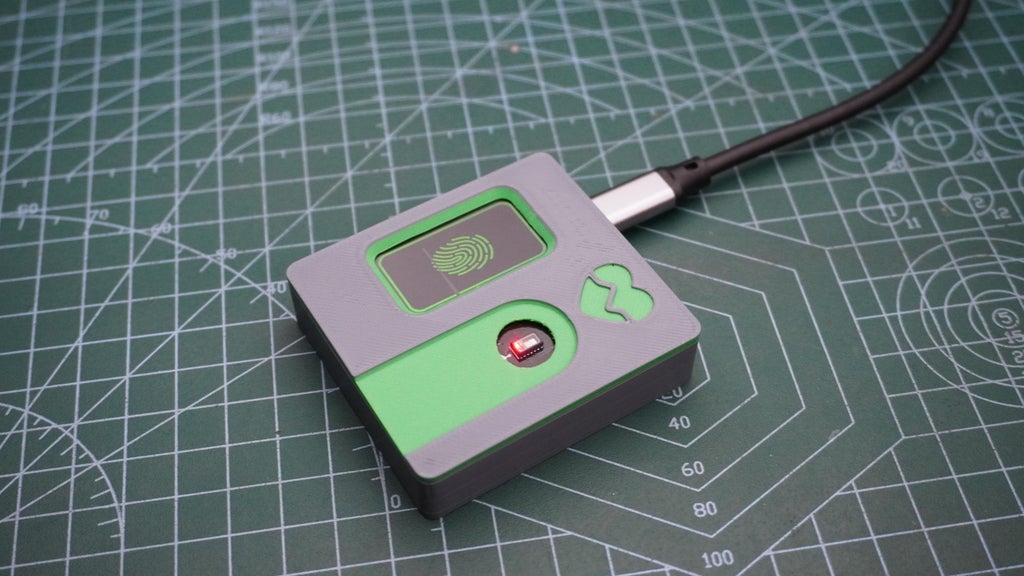
Once the upload is finished, the AI Oximeter firmware is successfully installed on your device and run.
This code is designed for an AI-powered Oximeter that measures SpO2 (oxygen saturation), heart rate, and body temperature using a MAX30102 sensor. It uses a TFT display to show the results and an Edge Impulse model to classify the user's health status based on the measured data.
This code integrates sensor data, TFT display, and AI inference:
Reads SpO2, heart rate, and temperature from the MAX30102 sensor.
Passes the data to an Edge Impulse model for classification.
Displays the results and status (Good, Bad, or Sick) on the TFT screen.
If you change the name of your Edge Impulse project, you must update the #include
#include
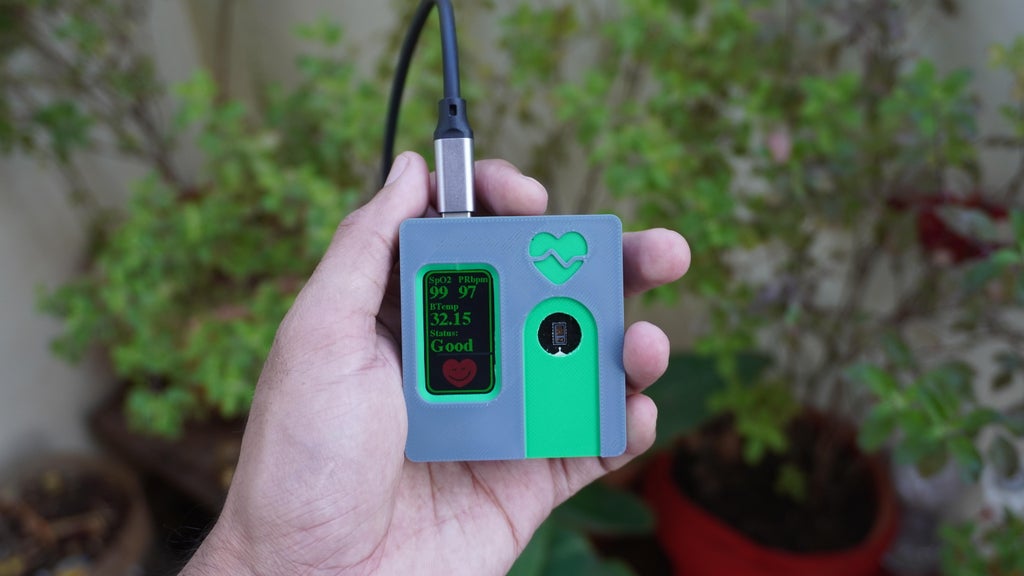
 This project demonstrates the successful integration of Edge Impulse's AI capabilities with real-time sensor data to build an AI-powered oximeter. By leveraging the MAX30102 sensor, ST7789 TFT display, and a custom-trained Edge Impulse model, we have created a compact and efficient device capable of monitoring vital health parameters such as SpO2, heart rate, and body temperature. The addition of AI-based classification enhances the oximeter's functionality by providing an intuitive assessment of the user's health status (Good, Bad, or Sick) based on real-time data.
It is important to note that this device is for educational purposes only and should not be trusted for professional health monitoring or diagnosis. While it demonstrates the potential of combining machine learning and IoT, it is not a certified medical device and should not be used as a replacement for medical-grade equipment.
Thank you for joining me on this journey. If you enjoyed this project, please don’t forget to like, comment, and share your own experiences. The future is filled with endless potential, and I’m excited to see what amazing projects you’ll create with this incredible technology.
See you next time, and happy making ;)


