

Draw beautiful antialiased circles in a programming environment, that has no functions for circles, like SDL.

Software apps and online services
Microsoft Visual Studio Code
Story
Without sine (sin sin). Yes, you don't need trigonometry to draw circles. You don't even need floats. Just check the Midpoint Circle Algorithm, or MCA. But whereas MCA draws aliased circles very fast, I will use a bit more time (and floats) to draw antialiased circles, both filled and outlined. Without trigonometry.
Basics
A point is on a circle outline, if the distance from the circle center to the point equals the radius of the circle. Ok, so you can set a pixel, if it's on the right distance from a given point. Pythagoras taught us to calculate the distance between two points. And we know that that distance is almost never an integer. Say that we have a radius of 7. If we go 7 pixels to the right from the middle point, we're at the outline. But all the other points? 6 steps to the right and 4 steps up? That point is 7.2111 pixels from the center. Shall we light it up? Or is 6 steps to the right and only 3 steps up a better pixel to light up? Its distance is 6.7082. The MCA algorithm and other aliasing methods light either pixel up. Antialiasing algos light both up, but blend them with the background depending on how far they are from the correct distance, or depending on something similar.
Why?
I started working on this, when I wanted to create a simple Game of Life app on my Unihiker. I had done it on a Sparkfun touch screen, where I could use a graphic library, which included circles. It turned out very nice, although the circles were aliased. But this Unihiker (M10), being a Unix machine, suddenly had no such graphic libraries. Well, sure there must be some, but before I found any, I challenged myself to write code for drawing circles. My code will draw circles on a bitmap, either directly on the screen, or on a sprite, or whatever picture data structure. The circles can be filled or outlined. The radius can be of any floating value. The coordinates of the middle point can be any floating value. And the outline thickness can be any floating value. A straight line, being horizontal or vertical, can only have a line thickness of an integer value. Sure you can kind of antialias any other float value for the thickness, but that will look blurred. With curved contours like simple circles, the antialiased outline kind of looks blurred, but when made perfect, it will have a very good looking line thickness. Just check with any decent graphick editor. Or Gimp. (See what I did there.)
Libre Office Calc to our rescue
I found a cool method in Libre Office Calc to draw mega sized pixels of a particular colour. It's about conditional formatting. I create a large grid of cells. Each cell is a perfect square. I fill each cell with a value telling how far it is from the center cell. Then I do the conditional formatting.
Make a top row going from say -12 to 12. Make a left column going from -12 to 12.
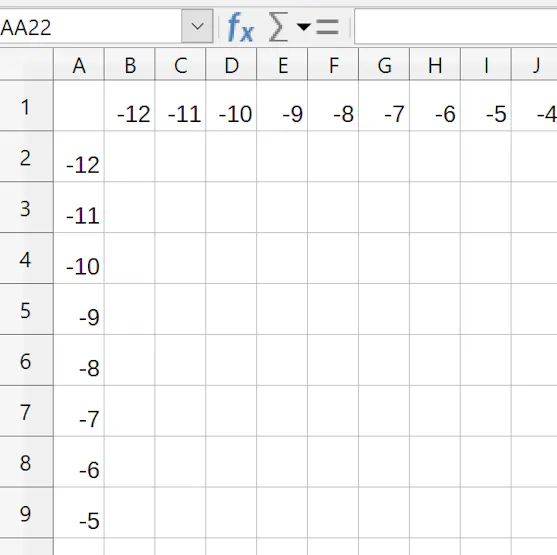
These are your X and Y axes. Then fill the cell B2 with the following formula:

If you don't know what the formula means, it picks the x value and the y value of the cell coordinates and calculates the distance. The $ signs in the formula are needed so you can copy the formula into each cell in the large grid. B$1 means that the B$1 stays the same when you copy downwards, while $A2 becomes $A3, $A4, $A5 etc, in the following rows. Likewise, when copying to the right, $A2 stays as $A2, while B$1 becomes C$1, D$1, E$1 etc.
Now you should have a large grid full of values telling how far each cell is from the middle cell.
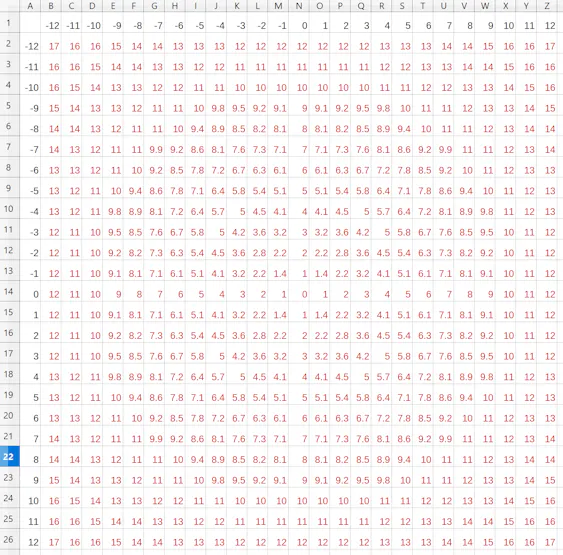
Say that we want to draw a circle with the radius 7. The Midpoint Circle Algorithm, MCA, does something as follows. Start at the N7 cell, where we have the value 7. That's our first pixel to mark. Move to the right, where we have 7.1. Below that we have 6.1. 7.1 is closer to 7, so we mark that and move further to right. 7.3 is closer to 7 than 6.3, so we pick that and go further to the right. Now 6.7 is closer to 7 than 7.6, so we pick 6.7 and go from this cell to the right, until we have picked all these cells:
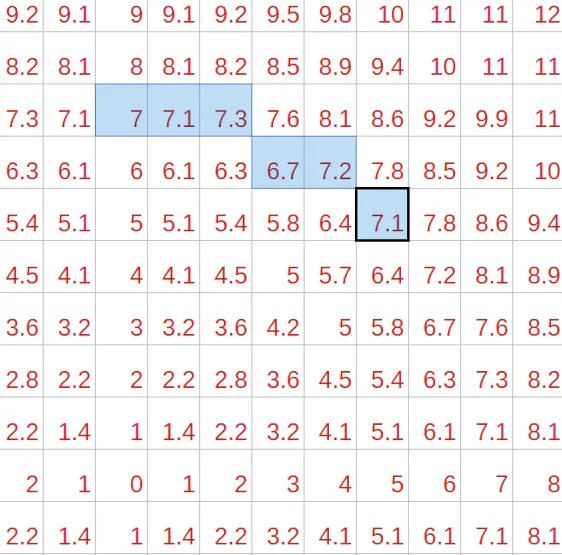
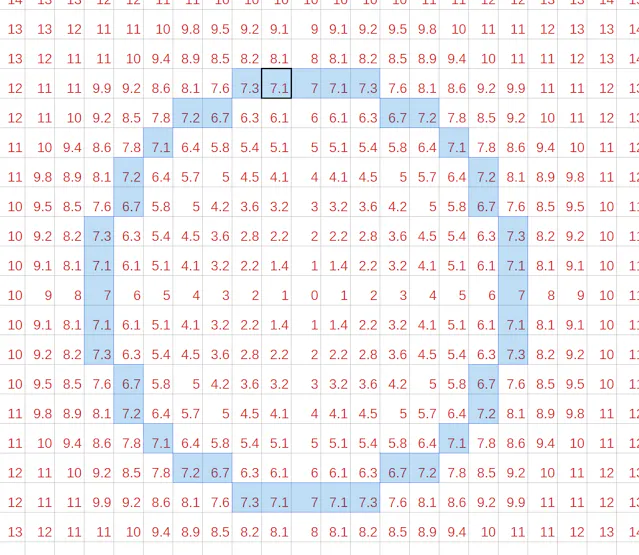
We have drawn 1/8 of the circle. The remaining 7/8 are identical to this, so we can just mirror this pattern.
The MCA circle would look like this, which is an aliased circle:
The antialiased approach would be as follows: Make all cells from 0.0 to 7.0 whilte and all cells greater than 8.0 black. And make all cells between 7.0 and 8.0 a greyscale according to the decimal part.
Here's how you do the formatting. Start by marking the whole grid.
Then go to Format, Contitional, Colour Scale...
Use the following values:
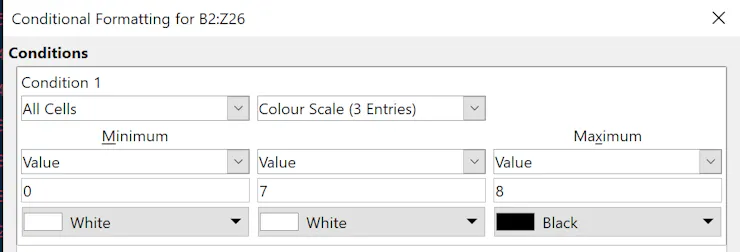
We use a colour scale for 3 entries. The minimum value is 0 and its colour is white. The middle value is 7 and its colour is white. Here we say that all cells with values from 0 to 7 are pure white. And the maximum value is 8 and its colour is black. All cell values between 7 and 8 will be interpolated to a grey scale. And all values beyond 8 will be pure black. Simple as that:
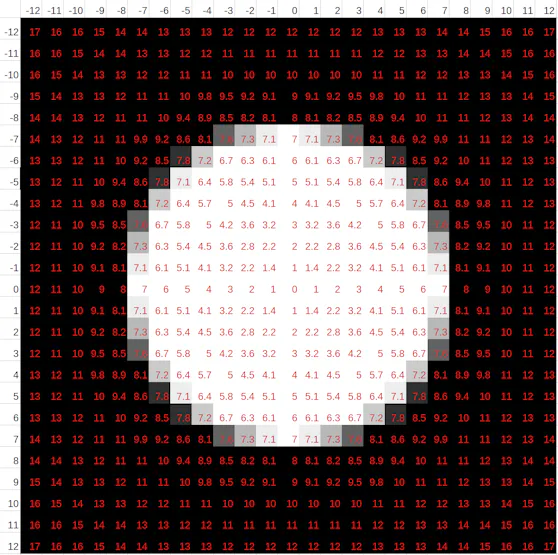
The pixels (or cells here) are always discrete elements, while antialiasing will create an illusion of something continuous. Is this circle just blurred? You don't get this as a result, if you take an aliased circle and just do a gaussian blur. Then again, if we adjust the values in the conditional formatting to this:
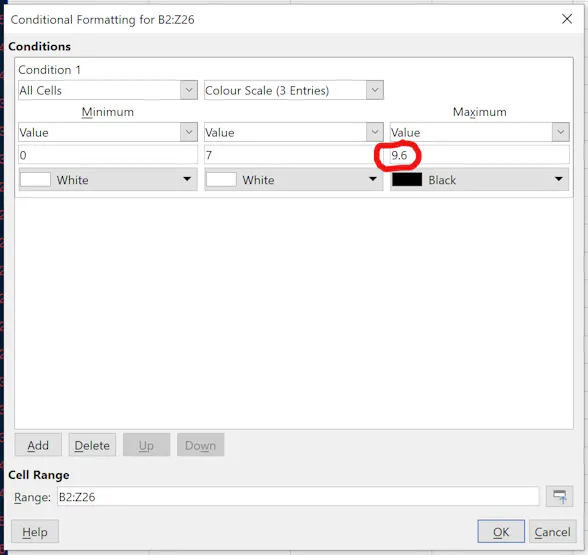
...we kind of get a 2.6 pixel wide soft border of the circle:

This is already a blurred circle. But who am I to tell what is strictly an antialiased circle and what is blurred?
Just a side note here. We haven't still used any trigonometry here to produce circles.
Outlined circles
To check how outlined circles would look like, we can still use Libre Office Calc and change the conditional formatting to this:

So, we make the center black. At distance 6, we fade in from black to white at 7 and further back to black at 8.
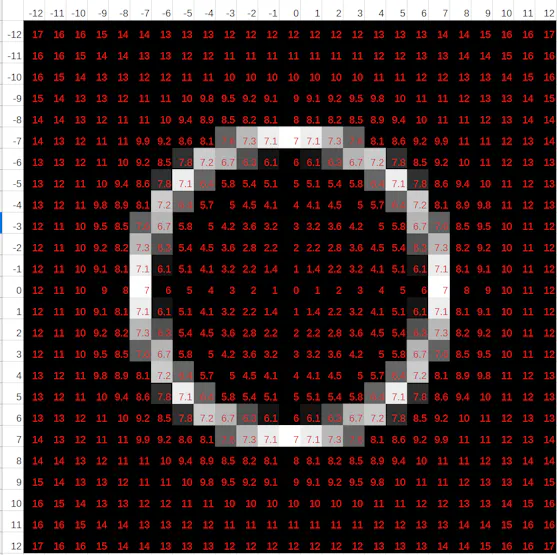
Using this tool in Libre Office Calc, we can only have three values to operate on, but transfering all this into a function in C/C++ to draw pixels in SDL/SDL2, we could add as many control points as we want in our envelope curve. Looking at the outlined circle above, we might want a bit more white on some pixels. The envelope could go from black to white from 6 to 6.7, stay on white from 6.7 to 7.3, then go from white to black from 7.3 to 8. To try to visualize this in Libre Office Calc, I would change the cell value to show the present value squared difference to the value 7. The formula in B2 would be:

After copying that formula to the whole grid (or should we call it a bitmap at this point), we see that the circle outline gets now values of 0 or slightly above. Now we still can use the Libre Office Calc tool for conditional formatting. We could use the following condition:

...where 0 stands for the middle line of the circle border, which has some width. The value 0.2 determins how far from the middle line the pure white extends (note that the value doesn't mean pixels). And between 0.2 and 1 it then fades to black, both at the outer edge and the inner edge of the circle outline. The settings above give the following circle:
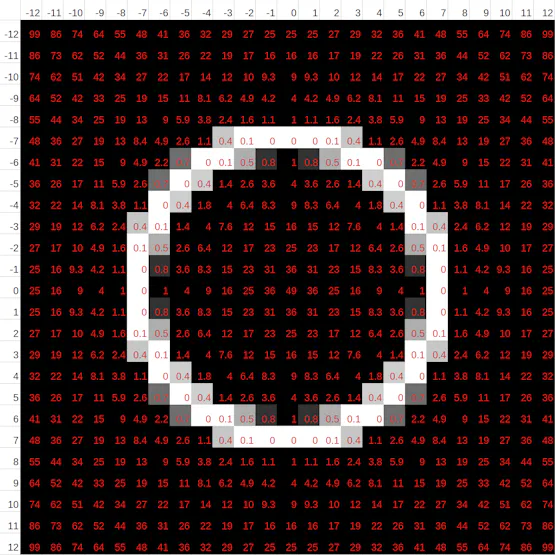
Here we are free to adjust the line thickness of the outline (the second value in the Conditional Formatting tool). And the fuzziness or blurriness or antialiasness of the contour (the third value in relation to the second value).
Everything could go float
...said Heraclitus. The only discrete thing here are the individual pixels. But as we've seen, the line width of the outline, the radius and the fuzziness are all float values, which really become something continuous (they don't round off into an integer in the drawing process). Even the coordinates of the center of the circle can be floats. To demonstrate this, I add an arbitrary fraction to the x and y axis values, say the value 0.23587 to the x axis and 0.6472 to the y axis.
It will result in this circle:

Just squint with your eyes, take off your glasses or whatever, to blur your sight a bit, and you'll notice that this is the same circle as the previous one, just shifted a fraction of a pixel. Its center point is not on a discrete pixel anymore.
In the following gif animation we see a circle grow and shrink a 10th of a pixel at a time.
Unihiker M10
The Unihiker M10 is a system-on-a-chip thing with a 240*320 pixel touch screen, some sensors and some GPIOs. It runs on Linux and the main user interface is Python based. You can add Python scripts of your own, which you pick to run from the touch interface.
But I don't like Python, so I installed g++ and everything I need to do the programming on the Linux itself. I use Visual Studio Code to create the connection to the Linux system. VS Code only provides a decent code editor and a text terminal to the Linux. Microsoft's Copilot kindly assisted me with all installation.
I implemented Conway's Game of Life, where I wanted to draw each cell as a small circle. I use a 24*32 grid, which fills the whole screen. I use 11*11 pixel tiles, which look nice. They overlap each other by one pixel row, but you won't notice it, because everything is so small, and the overlapping pixels are very faint due to the antialiasing.

I use SDL2 for drawing the graphics. But the library doesn't really have much functions for actual graphics, so you have to either include more libraries or write your own functions. For a simple 11 by 11 pixel array, I could have just hardcoded a byte array, pasting data from Libre Office Calc. Then again, I might want to extend the possibilities to circles of any size and line thickness, so why not do the coding from scratch.
Here's a snippet from the code, showing how I fill 11*11 pixels with a greyscale pixel:
// Fill 11x11 with a small anti-aliased disk (white center, fading to black)
for (int y = 0; y < 11; ++y)
{
  Uint8* row = static_cast<Uint8*>(pixels) + y * pitch;
  Uint32* px = reinterpret_cast<Uint32*>(row);
  for (int x = 0; x < 11; ++x)
  {
    float dx = float(x) - 5.0f;
    float dy = float(y) - 5.0f;
    float dist = std::sqrt(dx*dx + dy*dy);
    // Simple radial falloff: bright center -> darker edge
    float v = 3.0f - dist;     // radius is 3 (middle point of circle outline)
    v = v * v;                 // sharpen
    // Map v to 0..255 and clamp
    int col = map(v, 0.4, 255, 7, 0);
    std::cout << col << ", ";
    // If you want opaque sprite:
    Uint32 p = SDL_MapRGBA(fmt, Uint8(col), Uint8(col), Uint8(col), 255);
    // If you want transparent outside, use alpha based on distance instead:
    // Uint8 a = Uint8(std::clamp( (3.5f - dist) / 1.0f * 255.0f, 0.0f, 255.0f ));
    // Uint32 p = SDL_MapRGBA(fmt, 255, 255, 255, a);
    px[x] = p; // safe: we write one 32-bit pixel; indexing bounds-checked by loops
  }
  std::cout << "\n";
}
The program is started from the terminal in VS Code, not from the Unihiker itself. The Unihiker is powered from my computer through the USB-C connector. When launched, it takes control over the Unihiker. When stopped, the control returns to the built in user interface of the Unihiker.
The 24 by 32 array world wraps around the edges. When drawing, cells are added, never erased. Each drawing action pauses the generating for 3 seconds.
Todo-list
• toggle between adding and erasing with a push button
• include a settings menu (speed, symmetry, whatnot...)
• write a Python script that can launch programs built with g++
• write a fully featured library for drawing circles using this approach
// Fill 11x11 with a small anti-aliased disk (white center, fading to black)
for (int y = 0; y < 11; ++y)
{
  Uint8* row = static_cast<Uint8*>(pixels) + y * pitch;
  Uint32* px = reinterpret_cast<Uint32*>(row);
  for (int x = 0; x < 11; ++x)
  {
    float dx = float(x) - 5.0f;
    float dy = float(y) - 5.0f;
    float dist = std::sqrt(dx*dx + dy*dy);
    // Simple radial falloff: bright center -> darker edge
    float v = 3.0f - dist;     // radius is 3 (middle point of circle outline)
    v = v * v;                 // sharpen
    // Map v to 0..255 and clamp
    int col = map(v, 0.4, 255, 7, 0);
    std::cout << col << ", ";
    // If you want opaque sprite:
    Uint32 p = SDL_MapRGBA(fmt, Uint8(col), Uint8(col), Uint8(col), 255);
    // If you want transparent outside, use alpha based on distance instead:
    // Uint8 a = Uint8(std::clamp( (3.5f - dist) / 1.0f * 255.0f, 0.0f, 255.0f ));
    // Uint32 p = SDL_MapRGBA(fmt, 255, 255, 255, a);
    px[x] = p; // safe: we write one 32-bit pixel; indexing bounds-checked by loops
  }
  std::cout << "\n";
}