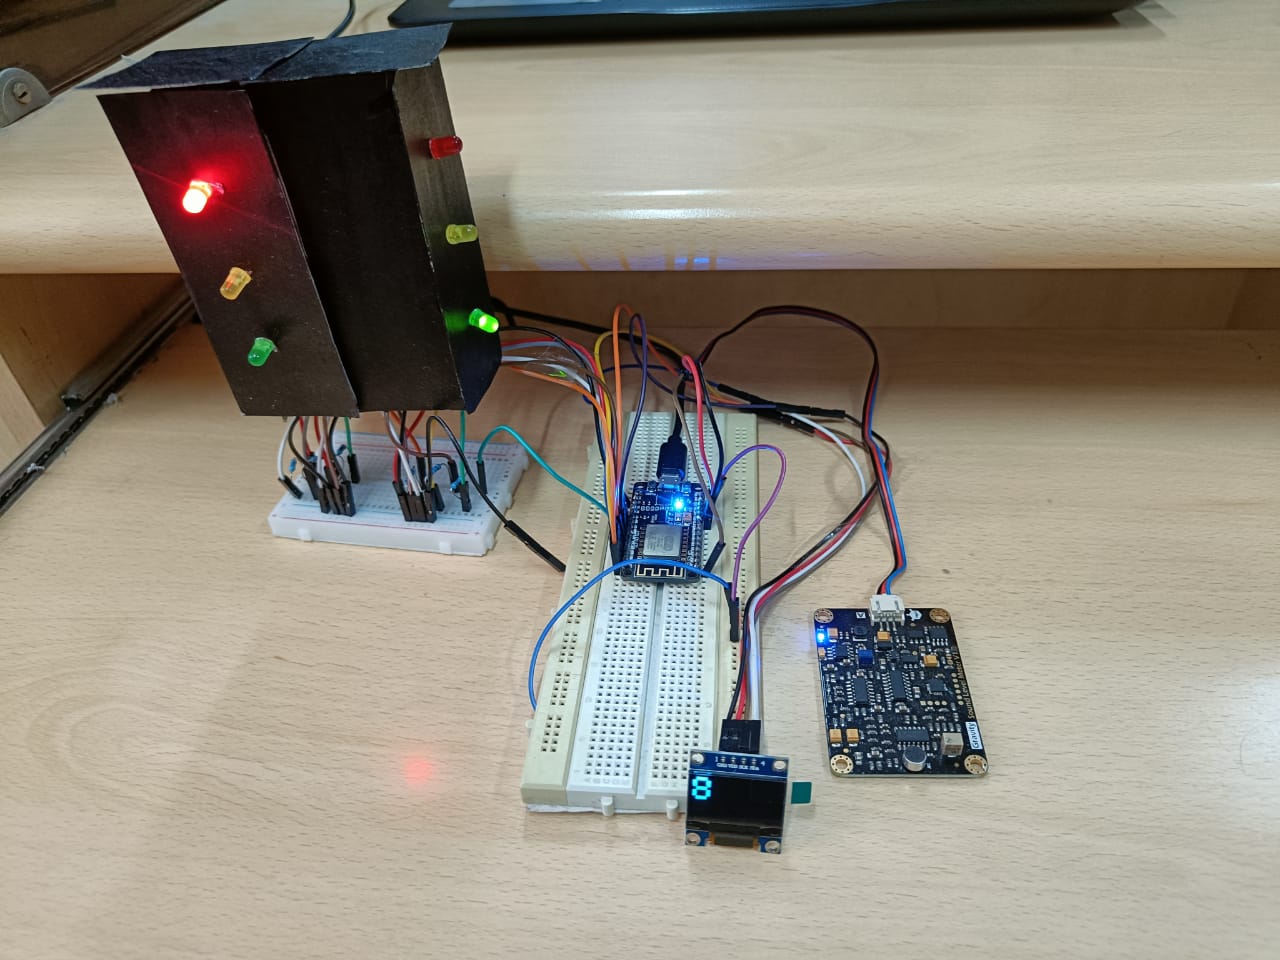
To bring awareness on noise pollution levels in places with heavy traffic inflow and introduce measures to discourage people from honking.
Things used in this project
Hardware components
Software apps and online services
Hand tools and fabrication machines
Soldering iron (generic)
Story
1. Introduction
1.1 Problem Statement
Noise pollution to a huge extent is neglected despite its short and long-term ramifications on human health. The various permissible noise limits in residential, commercial, and industrial areas should be strictly followed in accordance with the governing law and WHO guidelines to reduce the effects of noise pollution on human health. Honking by commuters near traffic junctions is one of the main sources of noise and the effect of increased automobile use in recent years especially in various metropolitan cities has resulted in increased noise levels in urban areas.
1.2 Solution
The solution focuses on traffic junctions throughout the city and plans to deploy a noise monitoring node at every junction. As a part of the solution to this project, we have implemented a "Punishing Signal" to create awareness about noise pollution among commuters. The implementation includes a noise pollution monitoring node that reads the noise levels at a given traffic junction and also the prototype of a traffic light controller which controls the flow of traffic at a junction. The idea is to discourage commuters from honking unnecessarily at a traffic light.
1.3 Proposed System - How it works
We aim to propose a low-cost, reliable, compact, and real-time OM2M and IoT noise pollution monitoring system at high-density traffic junctions and develop a mechanism to discourage people from honking.
We use ESP8266 microcontroller interfaced with DF Robot Analog Sound Level Meter sensor whose output is in Decibels with 'A' weighting (dB(A)) with the same weighting closest to how humans perceive sound. The Traffic Signal Controller code to implement the Punishing Signal runs on Arduino IDE.
The traffic signal prototype is programmed to stay RED for 20 seconds, YELLOW for 3 seconds, and GREEN for 30 seconds. The countdown timer for each state is shown on an OLED screen. When the noise level above a specified threshold is sensed for more than 3 times when the traffic signal is in RED state then 10 seconds is added to the red signal countdown timer.
The noise data, signal status, and countdown timer are all sent to the OM2M Eclipse server, and using OM2M functionality the data is subscribed to a Django server. The data from the Django server is created into a database in PostgreSQL. The database is then used to create a Grafana dashboard for analytics.
2. Prerequisites
Arduino IDE 1.8.5 or later(To compile and upload code on sensor nodes)JAVA 1.8 (To run the OneM2m platform)Eclipse OM2M v1.4.1 (implementation of the standard used in the project)NodeJS v14PostmanGrafana v9.2 or later
3. High-Level Software/Hardware Architecture
3. Implementation of the Punishing Signal
3.1 Schematics
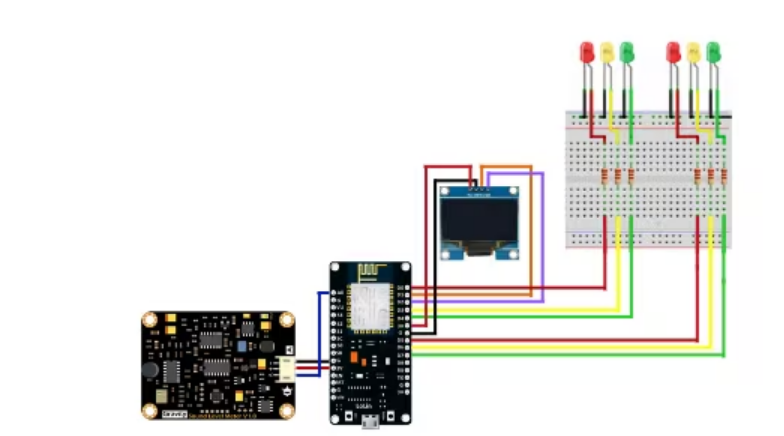
Connect the DFRobot Analog Sound sensor, OLED, and the respective LEDs to the NodeMCU board using the following components:
BreadboardNodeMCU boardDFRobot Analog Sound Level MeterOLEDRed, Green, and Yellow LEDs.220 ohmic resistors per LED.

Circuit Diagram and connections.
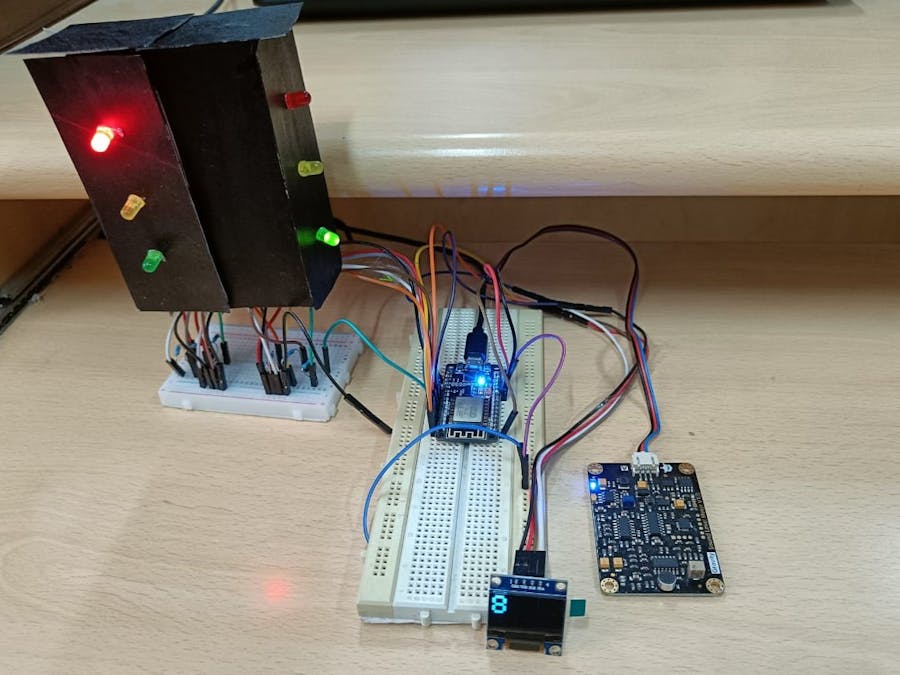
3.2 Prototype

3.2 Flowchart

Flowchart of the implementation of the Punishing Signal in Arduino IDE
You can view the flowchart in detail here: shorturl.at/AQSX8
3.3 Working
Imposing the RED signal is done when the noise levels exceed the threshold more than 3 times. This is done by initiating a counter and is based on the frequency of noise levels in dB(A) above the threshold. If it exceeds the threshold count again during the imposition of the RED signal, an additional 10 seconds are added to the wait time.
The Traffic Signal is demonstrated by using 3 LEDs which glow corresponding to their interval. Considering an intersection with the main road and a side road crossing the main road the time interval taken for the signal is 20 seconds and the GREEN signal is 30 seconds for the main road and 30 seconds for RED and 20 seconds for GREEN for the side road. Yellow LED will glow on each transition between GREEN to RED for 3 seconds. The countdown timer for each state is shown on an OLED screen. When the noise level above a specified threshold is sensed for more than 3 times when the traffic signal is in RED state then 10 seconds is added to the red signal countdown timer as a punishment for excessive and unnecessary honking. If the commuters still honk even after 10 second punishment has been added and the noise levels cross the threshold more than 3 times again another 10 seconds is added to count down the timer as a punishment the second time. We have limited the number of punishments to 3 times. After the maximum number of punishments, the traffic light will go back to green and it will work as the regular traffic light controller.
4. Actuators - Display Message
A message is generated to be flashed and displayed at the junction during the imposed AMBER signal time. The counter of the Signal states is also displayed clearly to the passengers. We are using an OLED connected to ESP8266 during the same interval. This puts into perspective the overall noise pollution and awareness to the general public of all the signals at the respective junction.
5. Scenarios and Scope of the Prototype
The threshold value can be changed according to the time of day and the recommended dB values following WHO guidelines. The Traffic Signal prototype can also be extended to 3- way T or Y junctions and even 4-way junctions respectively.
OneM2M can also be used to push data from various sensors data from across the city and store it in one place.
_pEztlZv7vV.png?auto=compress%2Cformat&w=740&h=555&fit=max)
Scope of the prototype

Central Pollution Control Board, India.
link to the CPCB guidelines:
http://www.cpcbenvis.nic.in/noise_pollution_main.html#
6. OneM2M implementation
6.1 Configure the IoT platform
The IoT platform for the Eclipse server will listen on port 8080. In this case, we have changed the port to 8453 by changing the configuration by editing the file: "config” file.
Activate the OM2M server. Opened the browser to access the OM2M IoT platform web interface: http://127.0.0.1:8453/webpage
6.2 OM2M Resource Tree
Using Postman, the resource tree is created by POST requests and the Application Entity - AE Sisphyus is shown below.

Creating the OM2M resource tree
6.3 Pushing Data to OM2M Eclipse server
We can see the content instances under the "Data" container updating the OM2M server. The attributes on the right also show the data sent from the Node MCU microcontroller Arduino IDE code. We are sending the data specifications of
node_id : which is the unique identifier of thedata content instancedB value of the noise level detectedSignal status as in GREEN, RED, AMBERTime out of the counter of the RED signalState indicating if timer has been extended.

6.4 Subscription from OM2M server
The subscription resource connects to the Django server and keeps track of the status of active subscriptions to the parent resource. A request from the issuer is notified about modifications to the parent resource.
In this case, the Django server is http://127.0.0.1:8000/

7. High-Level Software/Hardware Architecture

Architecture of the entire prototype
8. Collecting Data from OM2M Server and Posting To PostgreSQL
The data from the server is pushed to OM2M and using the subscription functionality, the Django server is now subscribed to the OM2M server. Django is an open-source Python framework used for highly functioning web applications, in this case, the server is used to create a database in PostgreSQL.
The following database is created in PostgreSQL.

9. Dashboard - Data Analysis
We’re then going to be using an analytics and visualization application called Grafana to display the information that has been stored in the database.
The Noise Pollution levels and Traffic Signal Controller Dashboard is set up on Grafana. The OM2M server content instances will then be posted to a time-series database in PostgreSQL.
We built our dashboard by creating panels. Each panel is essentially a graphic that uses a query to pull information from the database that is provided as the data source for the dashboard.
We set up a Bar gauge and a line graph for dB value metrics from the database table. We also set each trend to display the minimum, maximum, and mean or average value recorded for the time period.
10. Demonstration
link to video-1 (Arduino Implementation)-
https://drive.google.com/file/d/1M-eykdCKUWgJowIy4t2ZT0ta-tGeZcYL/view?usp=share_link
link to video-2(oneM2M Implementation)-
https://drive.google.com/file/d/1icb4IM69fR-zVg6txvIEWRMs8T_GYOFQ/view?usp=share_link
Schematics
Prototype
Shows the circuit connections made using the hardware for the project.

Schematic

The article was first published in hackster, November 21, 2022
cr: https://www.hackster.io/sisyphus/onem2m-and-iot-based-noise-pollution-monitoring-system-f32086
author: Team Sisyphus: Hoyasala Devi K, Sreekanth Reddy Bodeddula, Pranati Tantravahi, Rucha Dhodapkar, Alekhya Pathak, Bob Flynn, Andreas Kraft, Miguel Angel Reina Ortega, SeungMyeong Jeong, Wonbae Son, Xavier Piednoir


