
Making a Desktop Geiger Counter with Unihiker --- Real-Time Nuclear Radiation Monitoring

I. Introduction
Radiation monitoring is super important these days. It's not just about health and safety - it also reveals some fascinating mysteries of science! Nuclear radiation refers to particles or electromagnetic waves given off by radioactive stuff. There are three types: alpha, beta, and gamma radiation. These radiations are part of our daily lives, with uses in medical diagnostics, energy production, and irradiating food. However, they also pose some risks. Understanding how these radiations work and safe levels of exposure can help us manage potential dangers better.
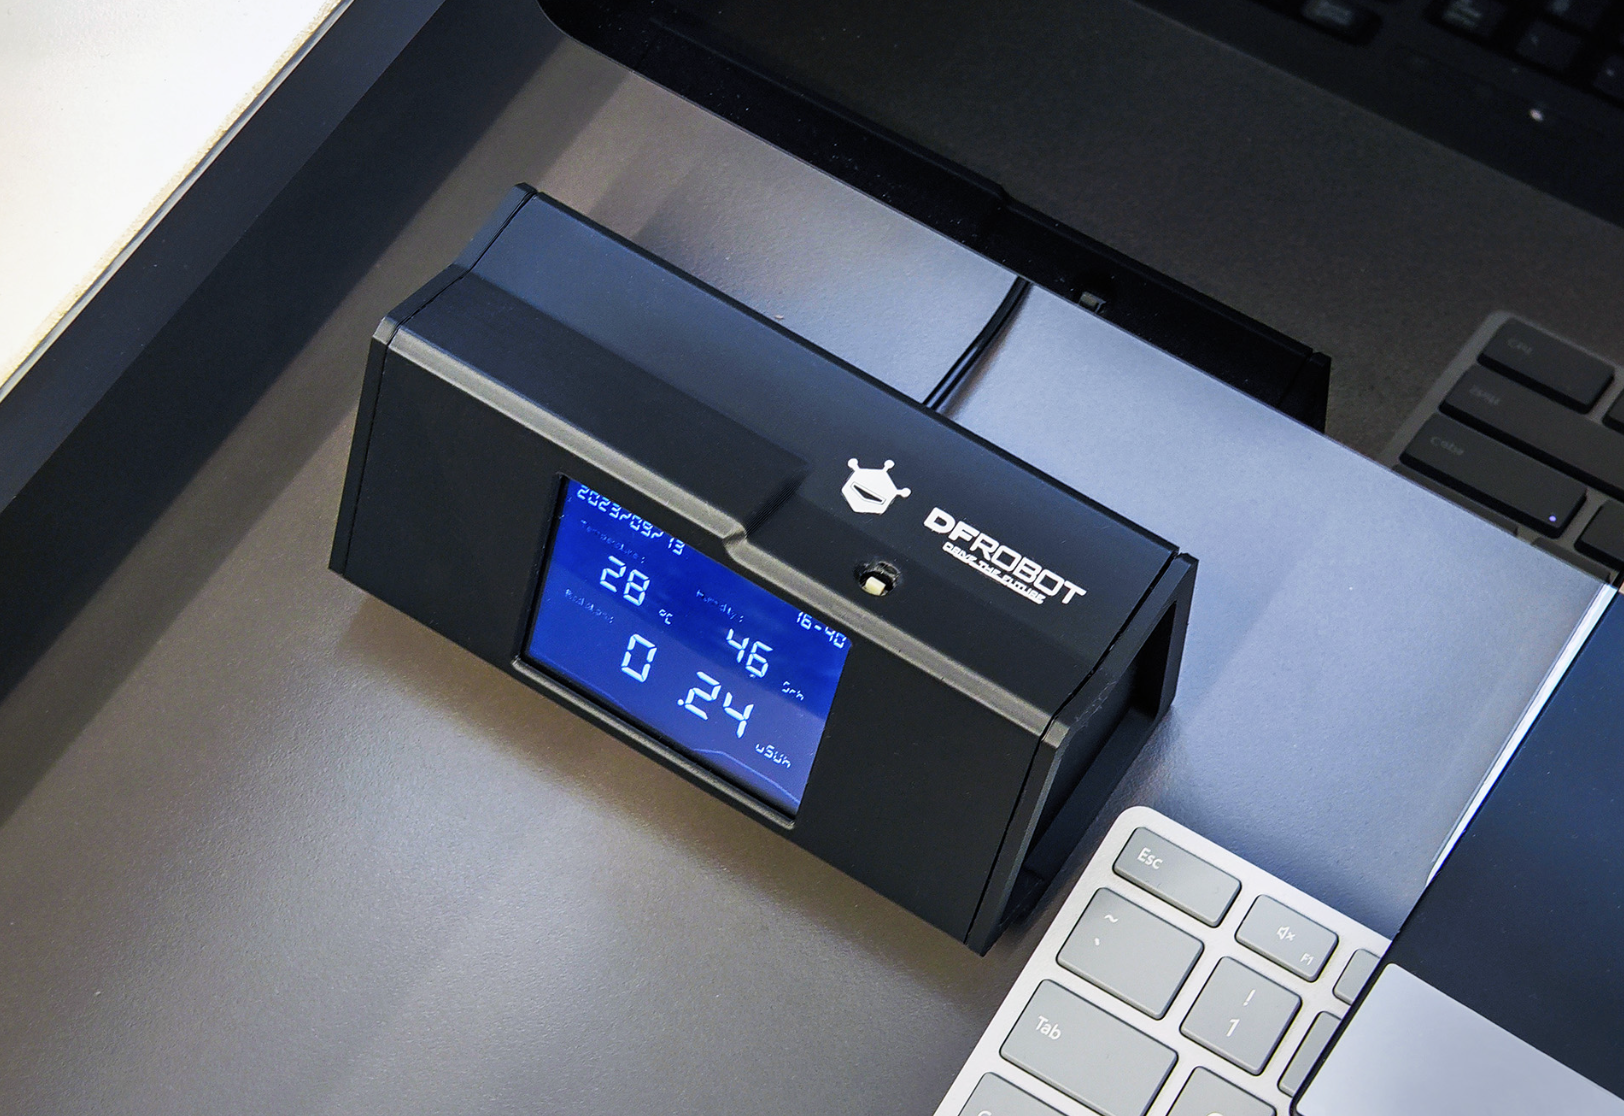
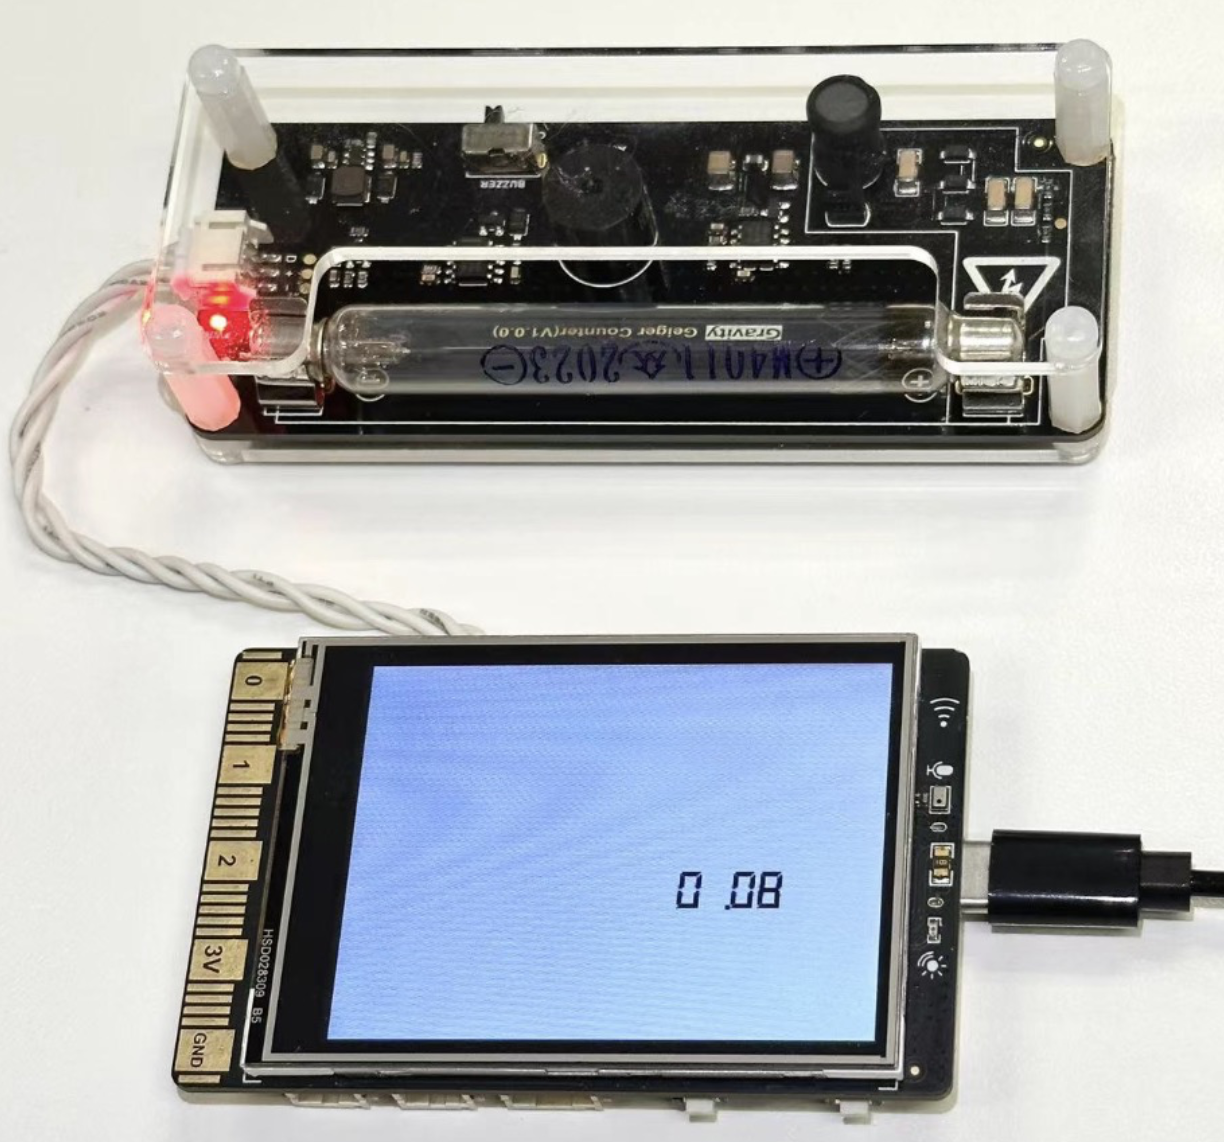
I had the idea to use a Unihiker to make a desktop Geiger counter. Basically, it's a device to detects the intensity of ionizing radiation. A typical Geiger counter has a sealed inflated tube and display that counts detected particles over time. I'll share how I DIY'ed the Geiger counter, to help with checking radiation levels in daily life.
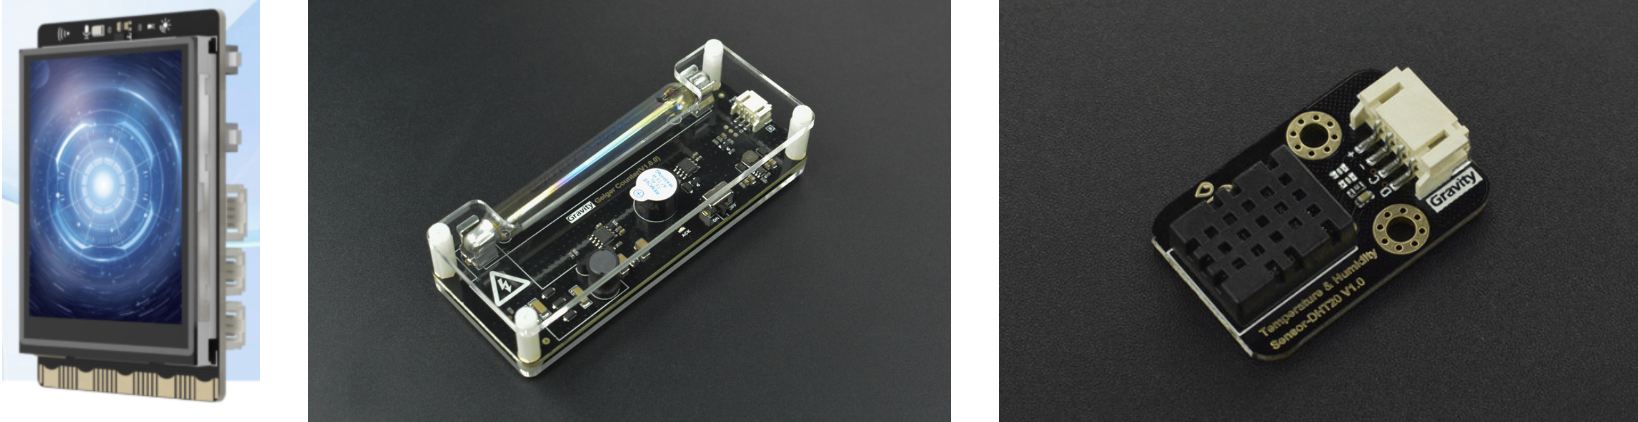
1. Hardware Selection
2. Wiring Diagram
- Connect the Geiger counter module to Pin 23 of the UniHiker board
- Connect the DHT20 temperature and humidity sensor to the I2C interface of the UniHiker board

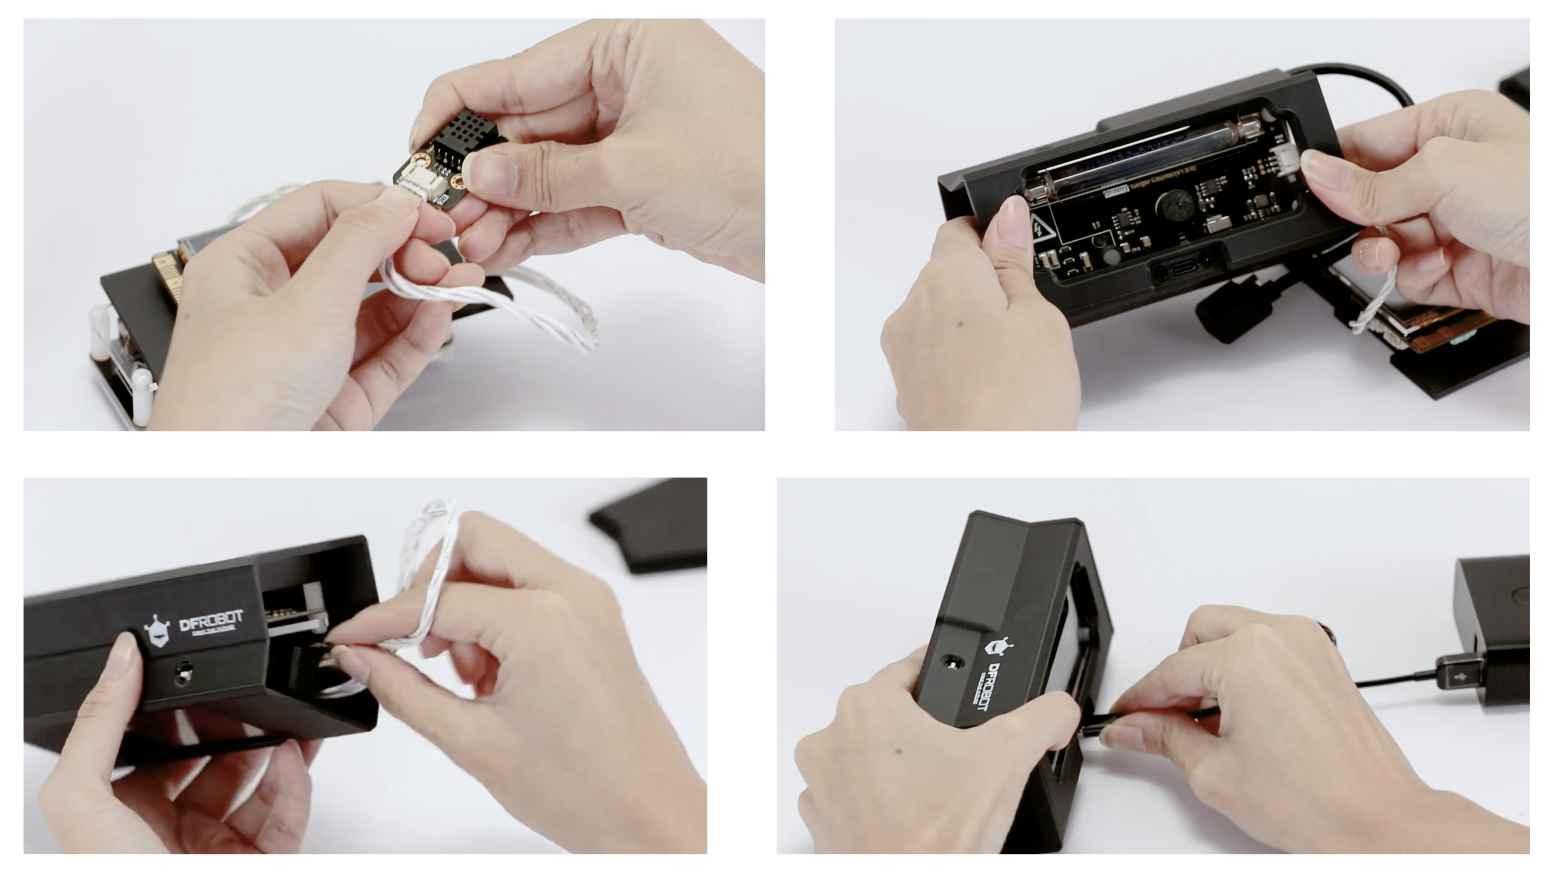
3. Print 3D Shell
3D files download here: https://www.thingiverse.com/thing:6224720/files


III. Principle of Geiger Counter
1. How to measure radiation?
Let me explain the working principle of a Geiger counter.
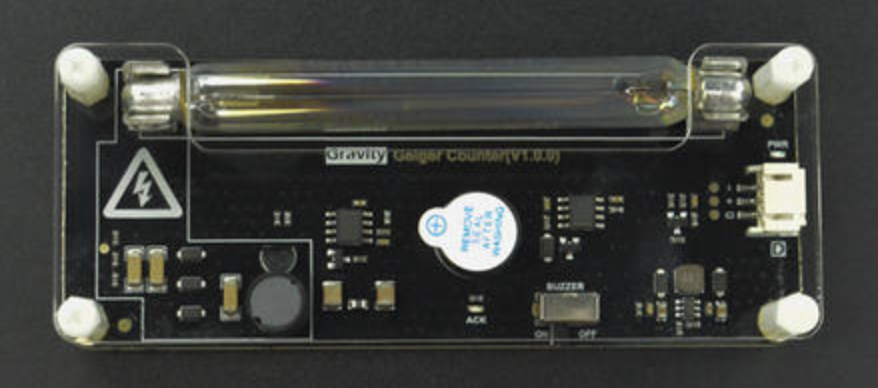
A Geiger counter is a gas-discharge detector filled with easily ionized gas. When radiation enters the tube, it causes gas ionization and generates current pulses. These pulse signals are amplified and become counting pulses. We just need to count the number of pulses per unit time to directly calculate the radiation level. Compared to other detectors, the biggest advantage of a Geiger-Müller tube is its digital output signal, which allows precise radiation counting without complex analog circuits. So by counting the radiation particles passing through the gas tube per minute, we can determine the radiation level of the current environment.

2. How to calculate radiation levels?
There are three key units: CPM, millisieverts (mSv/h), and microsieverts (μSv/h).
CPM (Counts Per Minute) is a unit of measurement for radiation levels, in counts/minute. It represents the number of times radiation particles hit the detector in one minute.
Radiation levels can be measured using the equilibrium dose rate per hour: (Sv/h), millisieverts (mSv/h), and microsieverts (μSv/h).
The conversion formula is: 151CPM = 1μSv/h
1Sv/h = 1000mSv/h = 1000000μSv/h
3. How to evaluate and quantify radiation levels?
The "Basic Standards for Radiation Health Protection" states that the annual dose equivalent limit for individual public exposure is: whole-body uniform irradiation not exceeding 5mSv; any single tissue/organ not exceeding 50mSv; the annual whole-body dose equivalent limit throughout life should not exceed 1mSv.
The standard for indoor nuclear radiation dose is 0.5μSV/h. Based on the annual public radiation dose limit of 5mSv/h, and calculating with 365*24 hours, the dose rate should not exceed 0.5μSv/h, which is considered normal. Generally, the normal indoor radiation dose rate is below 0.20μSv/h, mostly around 0.13. However, radiation levels in bathrooms and kitchens tend to be higher.
III. Program Editing
1. Use Python to calculate μSv/h
Calculate how many times the pin interrupt is triggered in a time interval (count) to determine how many radiation particles passed through. Here we first set it to calculate every 5 seconds (time_gap). Then use 60 seconds/5 seconds * particles passed to calculate particles per minute (cpm). Since 151CPM = 1μSv/h, we can derive the μSv/h value.
2. Load the pinpong library to control the Geiger counter in Python.
Load the GUI library to display numbers on the screen.
Connect the sensor to pin p23 as signal input.
import time
from pinpong.board import Board,Pin

Board("unihiker").begin()
from unihiker import GUI
gui=GUI()
btn = Pin(Pin.P23, Pin.IN)
3. Set variables and functions:
- time_gap: time interval between calculating μSv/h values
- start_time: time when counting starts
- count: number of particles passed
- time_gap: time interval between calculations
- uSvh: final calculated radiation value
- Define zero function to set start time and reset count to zero
- Define interrupt function, increment particle count by 1 on falling edge
- Define get_cpm function to calculate usvh value
time_gap = 0
start_time = 0
count = 0
time_gap = 5
uSvh = 0

def zero():
    global start_time,count
    start_time = time.time()
    count = 0

def btn_falling_handler(pin):
    global count
    count += 1

zero()
btn.irq(trigger=Pin.IRQ_FALLING, handler=btn_falling_handler)

def get_cpm():
    global uSvh
    if time.time() - start_time >= time_gap:
        uSvh = round((count/151)*(60/time_gap),2)
        print("uSvh=",uSvh)
        zero()
4. Display on Screen
- Display the current radiation value in 150*90 pixel black font size 20
- Call get_cpm function and update the text on display
dig = gui.draw_digit(x=150, y=90, text=uSvh, origin = "center",color="black",font_size=20,angle=90)

while True:
    #start()
    time.sleep(1)
    get_cpm()
    dig.config(text=uSvh)
5. Complete Code
import time
from pinpong.board import Board,Pin
Board("unihiker").begin()
from unihiker import GUI
gui=GUI()
btn = Pin(Pin.P23, Pin.IN)
time_gap = 0
start_time = 0
count = 0
time_gap = 5
uSvh = 0
def zero():
global start_time,count
start_time = time.time()
count = 0
def btn_falling_handler(pin):
global count
count += 1
zero()
btn.irq(trigger=Pin.IRQ_FALLING, handler=btn_falling_handler)
def get_cpm():
global uSvh
if time.time() - start_time >= time_gap:
uSvh = round((count/151)*(60/time_gap),2)
print("uSvh=",uSvh)
zero()
dig = gui.draw_digit(x=150, y=90, text=uSvh, origin = "center",color="black",font_size=20,angle=90)
while True:
#start()
time.sleep(1)
get_cpm()
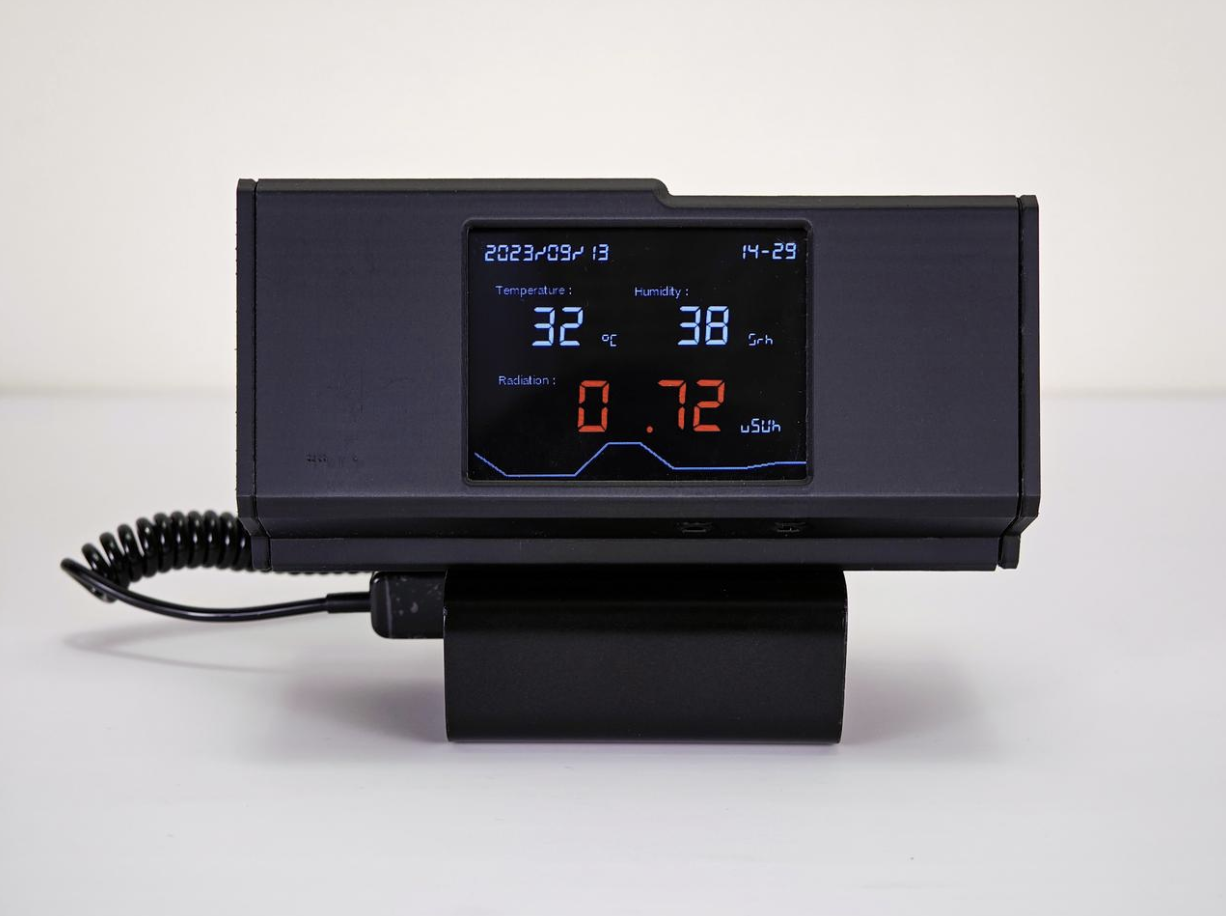
dig.config(text=uSvh)4. Display Optimization
Now the radiation value is displayed, but the screen looks a bit plain. We can try adding a temperature and humidity sensor, showing temperature, humidity, real-time date/time info, and a line chart of radiation value changes. When the radiation exceeds 0.5μSvh, the UniHiker board beeps and the value turns red.
import time
from pinpong.board import Board,Pin
import time
from pinpong.libs.dfrobot_dht20 import DHT20
from pinpong.extension.unihiker import *


Board("unihiker").begin()
from unihiker import GUI
gui=GUI()

btn = Pin(Pin.P23, Pin.IN)
p_dht20 = DHT20()
#global num_pulse1

time_gap = 0
start_time = 0
count = 0
time_gap = 5
uSvh = 0


def zero():
    global start_time,count
    start_time = time.time()
    count = 0
#    print('start',start_time)


def btn_falling_handler(pin):
    global count
    count += 1
    # print("pulse = ", count)

zero()

btn.irq(trigger=Pin.IRQ_FALLING, handler=btn_falling_handler)


def get_cpm():
    # print("time:",time.time())
    global uSvh
    global dht1
    global p_dht20
    if time.time() - start_time >= time_gap:
        print("-------------------")
        print("count=",count)
        uSvh = round((count/151)*(60/time_gap),2)
        print("uSvh=",uSvh)


        zero()


def numberMap(x, in_min, in_max, out_min, out_max):
  return (x - in_min) * (out_max - out_min) / (in_max - in_min) + out_min

uSvh_list = [0,0,0,0,0,0,0,0,0,0,0]

bg = gui.fill_rect(x=0, y=0, w=240, h=320,  width=3, color=(0, 0, 0),onclick=lambda: print("rect clicked"))
tem1 = gui.draw_text(x=55, y=263, text="Temperature :", origin = "center",color="white",font_size=8,angle=90)
tem2 = gui.draw_digit(x=95,y=240,text=(int(float(p_dht20.temp_c()))),origin = "center",color="white",font_size=33,angle=90)
tem3 = gui.draw_digit(x=105, y=190, text="°C", origin = "center",color="white",font_size=10,angle=90)
humi1 = gui.draw_text(x=57, y=140, text="Humidity :", origin = "center",color="white",font_size=8,angle=90)
humi2 = gui.draw_digit(x=95,y=100,text=(int(float(p_dht20.humidity()))),origin = "center",color="white",font_size=33,angle=90)
humi3 = gui.draw_digit(x=105, y=45, text="%rh", origin = "center",color="white",font_size=10,angle=90)

u1 = gui.draw_text(x=143, y=270, text="Radiation :", origin = "center",color="white",font_size=8,angle=90)
u2 = gui.draw_digit(x=175, y=150, text=uSvh, origin = "center",color="white",font_size=45,angle=90)
u3 = gui.draw_digit(x=190, y=45, text="uSvh", origin = "center",color="white",font_size=12,angle=90)

DigitalTime=gui.draw_digit(text=time.strftime("%Y/%m/%d          %H:%M"),x=10,y=310,font_size=15, color="white",angle=90)

if (len(uSvh_list) >= 12):
    uSvh_list.pop((len(uSvh_list) - 1))
print(uSvh_list)
line1=gui.draw_line(x0=(numberMap((uSvh_list[0]), 0, 1.1, 239, 200)),y0=320,x1=(numberMap((uSvh_list[1]), 0, 1.1, 239, 200)),y1=288,width=2,color="#acacac")
line2=gui.draw_line(x0=(numberMap((uSvh_list[1]), 0, 1.1, 239, 200)),y0=288,x1=(numberMap((uSvh_list[2]), 0, 1.1, 239, 200)),y1=256,width=2,color="#acacac")
line3=gui.draw_line(x0=(numberMap((uSvh_list[2]), 0, 1.1, 239, 200)),y0=256,x1=(numberMap((uSvh_list[3]), 0, 1.1, 239, 200)),y1=224,width=2,color="#acacac")
line4=gui.draw_line(x0=(numberMap((uSvh_list[3]), 0, 1.1, 239, 200)),y0=224,x1=(numberMap((uSvh_list[4]), 0, 1.1, 239, 200)),y1=192,width=2,color="#acacac")
line5=gui.draw_line(x0=(numberMap((uSvh_list[4]), 0, 1.1, 239, 200)),y0=192,x1=(numberMap((uSvh_list[5]), 0, 1.1, 239, 200)),y1=160,width=2,color="#acacac")
line6=gui.draw_line(x0=(numberMap((uSvh_list[5]), 0, 1.1, 239, 200)),y0=160,x1=(numberMap((uSvh_list[6]), 0, 1.1, 239, 200)),y1=128,width=2,color="#acacac")
line7=gui.draw_line(x0=(numberMap((uSvh_list[6]), 0, 1.1, 239, 200)),y0=128,x1=(numberMap((uSvh_list[7]), 0, 1.1, 239, 200)),y1=96,width=2,color="#acacac")
line8=gui.draw_line(x0=(numberMap((uSvh_list[7]), 0, 1.1, 239, 200)),y0=96,x1=(numberMap((uSvh_list[8]), 0, 1.1, 239, 200)),y1=64,width=2,color="#acacac")
line9=gui.draw_line(x0=(numberMap((uSvh_list[8]), 0, 1.1, 239, 200)),y0=64,x1=(numberMap((uSvh_list[9]), 0, 1.1, 239, 200)),y1=32,width=2,color="#acacac")
line10=gui.draw_line(x0=(numberMap((uSvh_list[9]), 0, 1.1, 239, 200)),y0=32,x1=(numberMap((uSvh_list[10]), 0, 1.1, 239, 200)),y1=0,width=2,color="#acacac")


while True:
    #start()
    time.sleep(1)
    get_cpm()
    # tem1.config(text="Temperature:")
    tem2.config(text=(int(float(p_dht20.temp_c()))))
    # humi1.config(text="Humidity:")
    humi2.config(text=(int(float(p_dht20.humidity()))))
    # u1.config(text="Radiation:")
    u2.config(text=uSvh,color="white")
    DigitalTime.config(text=time.strftime("%Y/%m/%d          %H:%M"))

    print(uSvh_list)
    uSvh_list.insert(0,uSvh)
    line1.config(x0=(numberMap((uSvh_list[0]), 0, 1.1, 239, 200)),y0=320,x1=(numberMap((uSvh_list[1]), 0, 1.1, 239, 200)),y1=288)
    line2.config(x0=(numberMap((uSvh_list[1]), 0, 1.1, 239, 200)),y0=288,x1=(numberMap((uSvh_list[2]), 0, 1.1, 239, 200)),y1=256)
    line3.config(x0=(numberMap((uSvh_list[2]), 0, 1.1, 239, 200)),y0=256,x1=(numberMap((uSvh_list[3]), 0, 1.1, 239, 200)),y1=224)
    line4.config(x0=(numberMap((uSvh_list[3]), 0, 1.1, 239, 200)),y0=224,x1=(numberMap((uSvh_list[4]), 0, 1.1, 239, 200)),y1=192)
    line5.config(x0=(numberMap((uSvh_list[4]), 0, 1.1, 239, 200)),y0=192,x1=(numberMap((uSvh_list[5]), 0, 1.1, 239, 200)),y1=160)
    line6.config(x0=(numberMap((uSvh_list[5]), 0, 1.1, 239, 200)),y0=160,x1=(numberMap((uSvh_list[6]), 0, 1.1, 239, 200)),y1=128)
    line7.config(x0=(numberMap((uSvh_list[6]), 0, 1.1, 239, 200)),y0=128,x1=(numberMap((uSvh_list[7]), 0, 1.1, 239, 200)),y1=96)
    line8.config(x0=(numberMap((uSvh_list[7]), 0, 1.1, 239, 200)),y0=96,x1=(numberMap((uSvh_list[8]), 0, 1.1, 239, 200)),y1=64)
    line9.config(x0=(numberMap((uSvh_list[8]), 0, 1.1, 239, 200)),y0=64,x1=(numberMap((uSvh_list[9]), 0, 1.1, 239, 200)),y1=32)
    line10.config(x0=(numberMap((uSvh_list[9]), 0, 1.1, 239, 200)),y0=32,x1=(numberMap((uSvh_list[10]), 0, 1.1, 239, 200)),y1=0)

    i = uSvh
    if (i > 0.5):
        u2.config(text=uSvh,color="red")
        buzzer.pitch(466,8)
        i = 0


    time.sleep(1)
- Temperature and humidity sensor: DHT20
- Load DHT20 sensor library: from pinpong.libs.dfrobot_dht20 import DHT20
- Display text horizontally by adding 'angle=90' after this code section. tem1 = gui.draw_text(x=55, y=263, text="Temperature :", origin = "center",color="white",font_size=8,angle=90)
- Draw line function: line1=gui.draw_line(x0=(numberMap((uSvh_list[0]), 0, 1.1, 239, 200)),y0=320,x1=(numberMap((uSvh_list[1]), 0, 1.1, 239, 200)),y1=288,width=2,color="#ACACAC")
- Display date and time: DigitalTime.config(text=time.strftime("%Y/%m/%d %H:%M"))
- Line chart always shows changes of latest 10 data points: def numberMap(x, in_min, in_max, out_min, out_max): return (x - in_min) * (out_max - out_min) / (in_max - in_min) + out_min
The desktop Geiger counter made using a Unihiker allows convenient real-time monitoring of ambient radiation levels. It has advantages like being simple to make, easy to use, and low cost. By just counting pulses, it can calculate radiation dose rates and help us stay aware of the radiation around us. Also, the Unihiker used in this project not only has a touchscreen but can connect to other hardware sensors. Programming directly in Python greatly increases flexibility. Compared to commercial detectors, this homemade device is more customizable - we can add alarm functions, data logging, and other intelligent features. Overall, it raises our radiation safety awareness and is a meaningful creative project.


