
Driver ID, location/velocity data, and seatbelt and alcohol detection for Fatal Accident Risk Mitigation (FARM) in vehicles.
Things used in this project
Hardware components
Software apps and online services
Datacake: https://www.hackster.io/datacake/products/datacake?ref=project-a93e30
Blues Wireless Notehub.io: https://www.hackster.io/blues-wireless/products/blues-wireless-notehub-io?ref=project-a93e30
Story
Based on the latest automobile accident and death data by the National Highway Transportation Safety Administration (NHTSA), there were over 38, 000 deaths in the United States in 2020, the highest since 2007. 2021 estimates are greater than 40, 000.
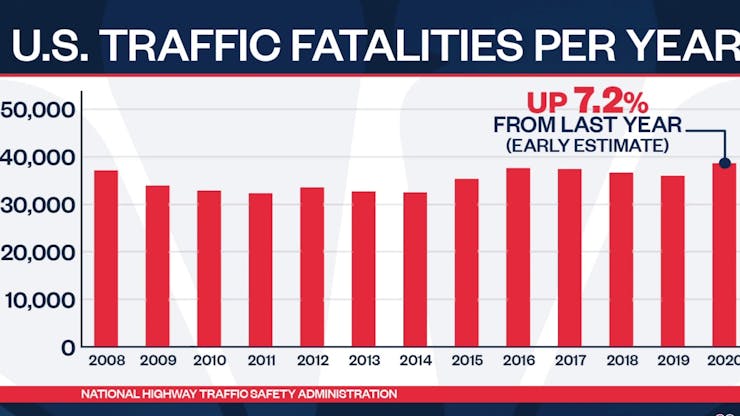
2021 estimates are even higher than 2020.
Per the NHTSA, in 45% of those fatal accidents, the drivers of passenger vehicles were engaged in at least one of the following risky behaviors: speeding, alcohol impairment, or not wearing a seat belt.
With the help of an Edge Impulse object detection model and a Blues Wireless Notecard, we can use the power of machine learning and wireless IOT to help mitigate those risky behaviors!
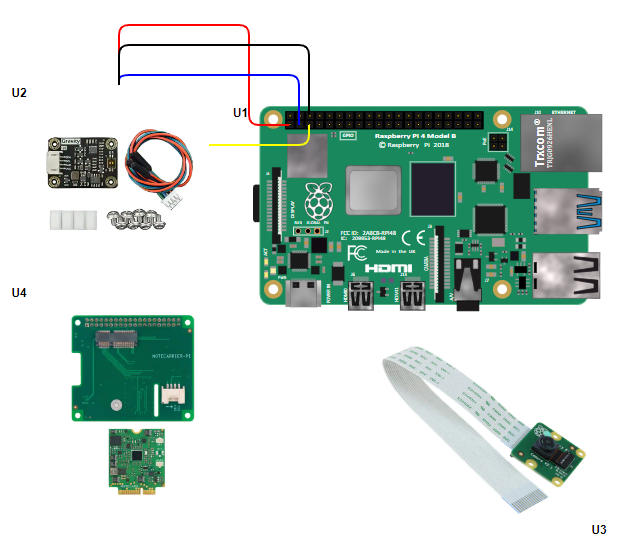
I call this project Fatal Accident Risk Mitigation (FARM). It is a proof of concept for a fleet management capability: to determine who from your team is driving the vehicle, are they wearing their seatbelt, are they travelling at a safe speed, and is alcohol detected in the car (either from an open bottle or from their breath). This can all be done using an Edge Impulse object detection model running on a Raspberry Pi 4, a Raspberry Pi camera, a Blues Wireless Notecard running on a Raspberry Pi HAT, and a DFRobot MQ-3 gas sensor. The setup can be powered via the vehicle's 12V power supply (ie cigarette lighter) or even a battery bank.
The first step in the project was creating the model, and for that I needed data. I used the Raspberry Pi and camera to take photos several hundred times while I was out driving so I had some realistic samples for what the model would be seeing. I collected around 300 images of me driving with my seatbelt on in various times of the day and different amounts of sunlight to vary the input. Here was the short Python script I developed to capture those images:
import os
import time

FRAMES = 200
TIMEBETWEEN = 6

frameCount = 0
while frameCount < FRAMES:
    imageNumber = str(frameCount).zfill(7)
    os.system("raspistill -o image%s.jpg"%(imageNumber))
    frameCount += 1
    time.sleep(TIMEBETWEEN - 6) #Takes roughly 6 seconds to take a picture
Once I had the images, I did a bulk upload into my Edge Impulse project. A public version of the project can be found here. Then came the tedious effort: labeling. Fortunately, Edge Impulse makes this pretty straightforward with the ability to label each image within its framework. For each image, I drew a bounding box around my face and a bounding box near the shoulder area showing the seatbelt on (but also some background to indicate that I'm wearing the seatbelt).
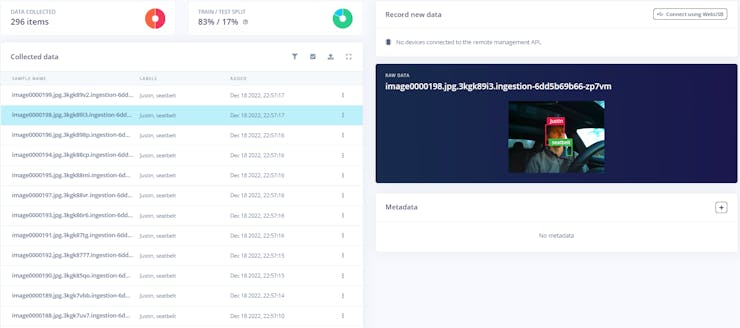
Labelling each photo is tedious, but the Edge Impulse environment makes it easy.
After all the images were labelled, I started the Impulse Design process. For the most part, I kept the default parameters that Edge Impulse recommended. As mentioned previously, I used an object detection framework. Since I was using a Raspberry Pi 4, I wasn't overly concerned about the model size. I used 320x320 RGB input images and trained for 50 training cycles using transfer learning on a YOLOV5 dataset imported by one of the Edge Impulse Experts. There is also a community YOLOV5 model that can be used as well. The model resulted in a 98.3% precision score with an inference time of 272 ms. The model size was 3.5 MB, so plenty of space for the Raspberry Pi 4.
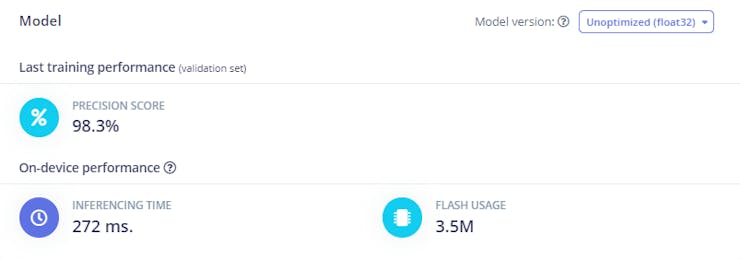
Good Precision score for the model!
I then deployed my model as a Linux (ARM V7).eim file.
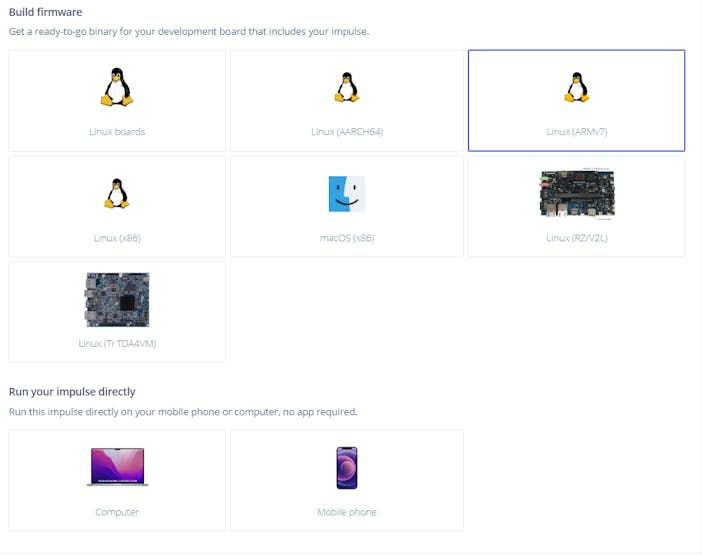
I deployed the model as a Linux .eim file.
Since I've done projects in the past using the.eim file, I leveraged that experience to develop Python code to load the model, read in images, classify those images, and then take action on the inference results (in this case send data to the Blues Wireless Notehub.io). The Python script can be seen on my github for which there is a link off of this project (see the code section).
Never being satisfied, once I had my code up and running I decided to add an alcohol sensor to the setup to see if I could detect the presence of alcohol in the car. I had a DFRobot Gravity Gas Sensor (MQ3) that I purchased a year ago, and recycled it for this project. Most MQ3 sensors are 5V and analog, which doesn't play nice with a Raspberry Pi. However, the DFRobot Gravity sensor is both 3.3V and 5V tolerant with an I2C interface, so connecting to the Raspberry Pi was super easy (no 5V to 3.3V TTL, and no ADC).
To test out my code, I mounted the Raspberry Pi (with HAT), camera, and alcohol sensor to the dashboard of my car and plugged it into the 12V power supply:
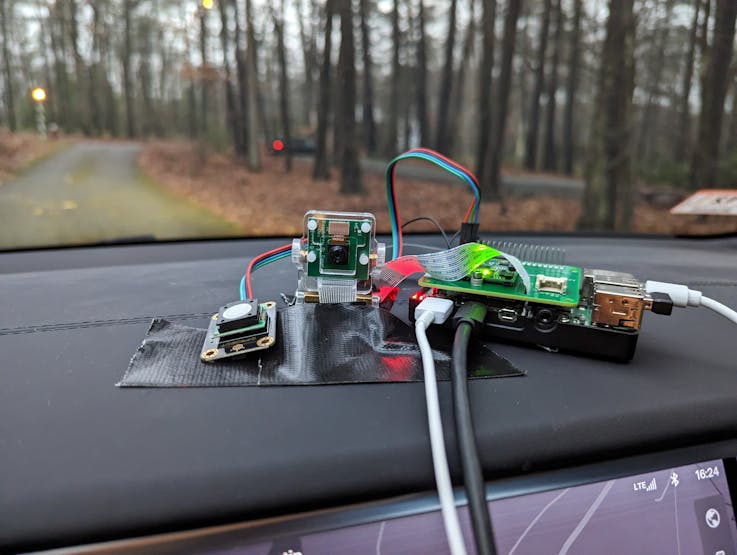
Mounting the Raspberry Pi with Notecard Pi Carrier, camera and gas sensor.
I also connected a small portable monitor and USB keyboard/mouse so I could see when I got a satellite fix for GPS (each time you power down the Notecard, you have to reacquire satellites). Once I got a GPS location, I drove around for a little bit. I set up my code so a Note is sent every 2 minutes with driver ID information, if they are wearing their seatbelt, and if alcohol is detected. Velocity and GPS information is sent automatically by the Notecard at a predetermined interval (in my case I set it up for every 20 seconds for fine grain location and velocity data).
The Notes are sent to Blues Wireless Notehub.io. You can see example Notes that were sent to Notehub.io below:
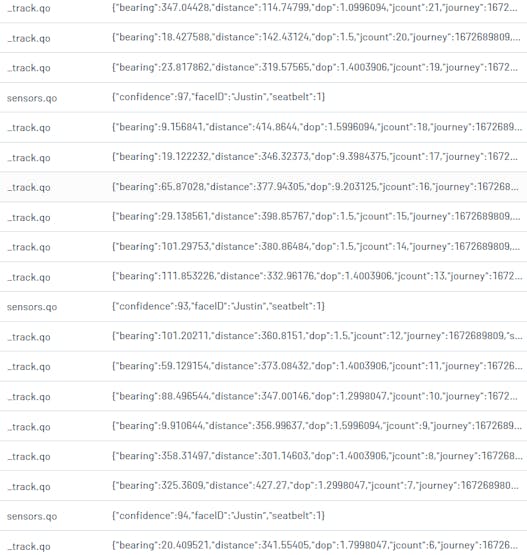
Example Notes from Notehub.io that capture inference and location/velocity information
I then followed Blues Wireless's excellent tutorials to create a route to Datacake, where I visualized the data of interest from the Notes: the latitude and longitude for location information, the driver name, velocity, seatbelt information, and detected alcohol data (static and trend). Below is my payload decoder code from the Datacake dashboard configuration tab:
function Decoder(request) {
var data = JSON.parse(request.body);
var device = data.device;
var file = data.file;
var decoded = {};
decoded.pi_location = "(" + data.where_lat + "," + data.where_lon + ")";
//detect excessive speed, convert to mph, 30 mph for test purposes
//recommend higher (80 mph?) to detect excessive speeding
if ( (data.body.velocity * 2.23694) > 30.0 )
{
decoded.max_velocity = data.body.velocity * 2.23694;
}
if (file === "locations.qos") {
decoded.voltage = data.body.voltage;
decoded.motion = data.body.motion;
decoded.seconds = data.body.seconds;
} else if (file === "_session.qo") {
decoded.voltage = data.voltage;
} else if (file === "sensors.qo") {
// custom application code
decoded.faceID = data.body.faceID;
decoded.confidence = data.body.confidence;
decoded.seatbelt = data.body.seatbelt;
decoded.alcohol_detected = data.body.alcohol_detected;
decoded.time = data.when;
}
if (("tower_lat" in data) && ("tower_lon" in data)) {
decoded.tower_location = "(" + data.tower_lat + "," + data.tower_lon + ")";
}
if (("where_lat" in data) && ("where_lon" in data)) {
decoded.device_location = "(" + data.where_lat + "," + data.where_lon + ")";
}
decoded.rssi = data.rssi;
decoded.bars = data.bars;
decoded.temp = data.temp;
decoded.orientation = data.orientation;
decoded.card_temperature = data.body.temperature;
// Array where we store the fields that are being sent to Datacake
var datacakeFields = []
// take each field from decodedElsysFields and convert them to Datacake format
for (var key in decoded) {
if (decoded.hasOwnProperty(key)) {
datacakeFields.push({field: key.toUpperCase(), value: decoded[key], device: device})
}
}
// forward data to Datacake
return datacakeFields;
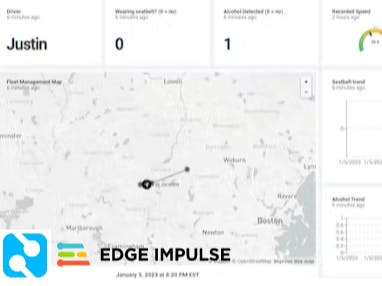
}Datacake does a solid job of visualizing the data as you can see below:
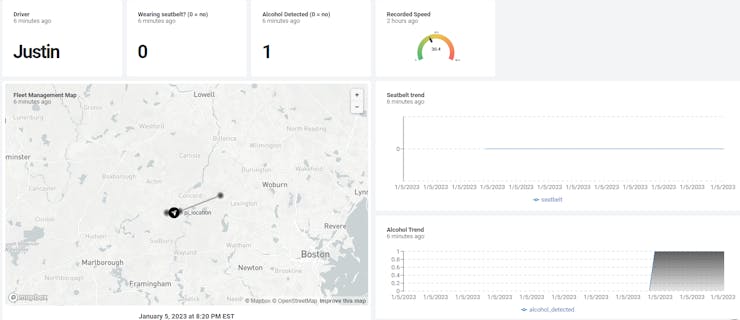
I can neither confirm nor deny I had a beer in my (parked) car to capture the alcohol trend.
The dashboard identifies the driver, if they are wearing their seatbelt, the vehicle speed (a threshold can be set, so you only see if they are speeding), the seatbelt trend (if they are wearing their seatbelt throughout the drive), the detected alcohol trend (and last reading), and the location information on a map. If you need immediate alerts of any of these behaviors, Notehub.io has a Twilio route option so you can receive text messages (if alcohol is detected for example). I didn't implement it in this demo, but it is a possibility for the future.
Final Thoughts
This was a fun project. I was happy with the performance of the model identifying me and if I was wearing a seatbelt. The alcohol sensor also performed very well. With just a sip of beer and exhaling, the sensor would trip the threshold for detecting the alcohol. I had some challenges setting the right parameters for the Notecard, but once I did, the results looked pretty good. Thank you to Rob Lauer and the Support team at Blues Wireless for their persistent help. Overall the Blues Wireless Notecard has a lot of capability and I'm looking forward to trying it in future projects.
The neat thing about this project is that no images are sent anywhere, so it is secure. There is a debug photo stored locally on the Raspberry Pi (to confirm what the camera is looking at) but that can be disabled in the code. Otherwise, the only thing sent to Notehub and Datacake is just meta-data!
One thing I did want to comment on were some limitations. First: the sun. Especially in the winter here in New England, the sun has a low angle in the sky. Depending on the direction you are driving, the Raspberry Pi camera can be blinded by the sun, resulting in missed detection of the driver and seatbelt. This could maybe be addressed with a different sensor (ToF, mmWave radar?). But for the majority of the time, this was not an issue. Second: my model only has classes for myself and the seatbelt. If additional drivers need to be accounted for, similar data collection and labelling (and model update) needs to happen. Third, I only did data collection in my car. If you have a fleet of vehicles, you would need to collect data for each vehicle type (since the seatbelt sits differently in each vehicle). When I tested out my code in my wife's car, I was easily identified, but the seatbelt wasn't. Also, since this is a EO camera-based system, it does not work in the dark. Perhaps I could have tested with a NoIR camera for night-time driving, but I kept the scope to daytime only. It could be a future enhancement. Lastly, the alcohol sensor can pick up several types of alcohols, to include hand sanitizer, so you could get a false positive with that. Further refinement of the sensor readings could probably filter that out though.
If you made it to the end of this write-up, thanks for reading. I hope you enjoyed. I'm happy that I was able to address all three factors that drove the majority of fatal accidents: speeding, alcohol impairment, and lack of seatbelt use. I hope this inspires future production products that mitigate the risk on the roads in order to "Build a Smarter World".
Schematics
Schematic
Code
RPi Blues Fleet Mgmt Source Code
The article was first published in hackster, December 17, 2022
cr: https://www.hackster.io/justinelutz/old-macdonald-had-a-farm-and-became-a-safer-driver-a93e30
author: Justin Lutz


